
Pick your Use Case
Start with your goal. Then follow short, step-by-step videos that show you how to set up Meltwater and put your use case into action.
Brand Monitoring
This playbook helps you get brand monitoring up and running quickly using the AI Search Assistant. It focuses on speed to insight, not a deep dive into the Explore.
Looking for broader media monitoring use cases or advanced workflows? Check out the Media Monitoring with Explore learning paths linked at the end.
Before You Build: Set the Right Mindset
Define Your End Goal
Brand monitoring works best when you know what you want the data to do.
A strong brand search is flexible. It should support multiple questions after it's built, but it needs one clear purpose up front. That purpose will guide how you build, refine, and analyze your results.
Ask yourself: What do I need this data for right now?
- Understand brand perception. Sentiment, trending themes, and how your brand is discussed across media and social
- Monitor coverage on specific channels. Where conversations are happening: news, broadcast, or key social platforms
- Identify influencers and advocates. Who is talking about your brand and driving engagement
- Track questions, issues, or risks. Concerns, complaints, or emerging issues tied to your brand
- Establish a baseline. A clean reference point to measure change over time
This keeps your brand search intentional and focused.
Once your search is built and validated, prompt the AI Search Assistant to explore different questions within that same search, without rebuilding it.
Build and Improve Your Search with AI
Use the AI Search Assistant to create your initial brand search.
Review, Refine, and Save Your Search
Search building is iterative. This step is your quality check.
Preview your results and ask yourself:
- Are these mentions actually about my brand?
- Am I missing obvious coverage?
- Is there too much noise?
Then use AI, filters, or manually refine:
(Optional) Watch: Use Boolean to manually adjust keywords
Once the results look good enough, save your search. Perfection comes later.
Analyze and Validate Insights
Once your search is saved, start analyzing what's coming in.
This is also a quality check step. If the results look off, return to Step 3 and refine.
Track & Monitor
Once your search is validated, decide how you want to stay informed.
- Smart Alerts for immediate notifications regarding shifts in your data
- Digest Reports for scheduled media scans
- Monitor Streams for ongoing, real-time visibility
Check out the playbook:
Optional Step: Use Mira Studio to Explore Your Data
Once your brand search is built and validated, open Mira Studio and enter in one of these prompts to quickly explore what's happening.
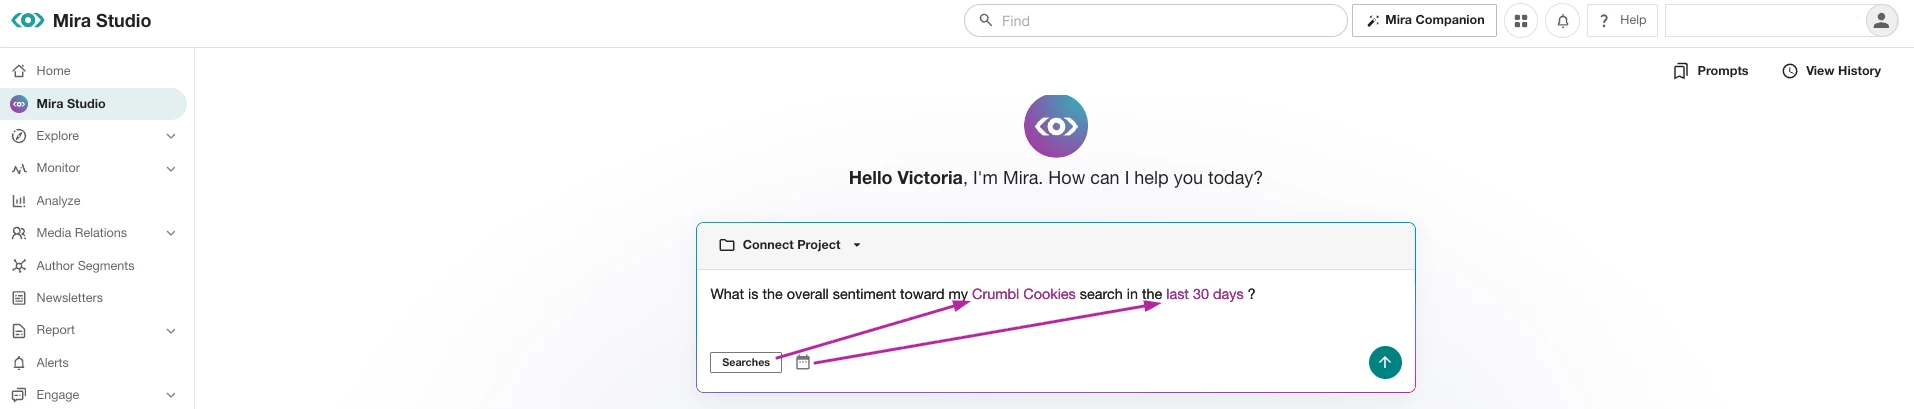
Brand Perception
Visibility and Coverage
Influencers and Impact
Questions, Issues, & Risks
Share Insights & Report
When you're ready to share insights with stakeholders:
See This Playbook in Action
Katie Washington, Brand & Reputation Monitoring Fellow
Katie is a Marketing Manager at Atrium Hospitality who runs this exact process across a corporate brand and 75+ hotel properties. Open her full Fellow Playbook below for her real monthly workflow, a live dashboard example, and the Boolean searches she uses every month.
Open Katie's Fellow Brand Reputation Playbook
Ready to Level Up Your Media Monitoring Skills?
Expand on your Explore knowledge with these learning paths:
Competitive Benchmarking
Whether you're evaluating your brand's position in the market or keeping a close eye on key competitors, this playbook is designed to help you stay informed, make smarter decisions, and stay one step ahead of the competition.
Before you begin, make sure you've created a search for your own brand using the Brand Monitoring Playbook.
Before You Build: Define Your Goal
Competitive benchmarking only works if you're comparing like for like.
Before creating competitor searches, get clear on the comparison you're making.
Ask yourself:
- What am I trying to compare? Volume, Sentiment, Engagement, or something else?
- Which competitors belong in this comparison? e.g., Coca-Cola vs. Pepsi is a true peer comparison. But if you're Fritz Kola, including Coca-Cola may still be useful to understand how much attention you're capturing from a category leader.
- Which channels should be included? News, social, broadcast, or a specific mix?
- What time frame am I analyzing?
These decisions shape how you build your searches and structure your benchmark report.
Create One Search Per Competitor
To create a competitive benchmarking report, each brand needs its own search or tag.
This keeps data segmented, enables side-by-side comparison, and supports reliable reporting in Analyze.
Use the same search-building process in Explore from the Brand Monitoring Playbook. Just swap in competitor names, products, social handles, and related terms.
Validate Your Searches
Before jumping into dashboard creation, do a quick quality check. This is the most important step in competitive benchmarking.
Confirm that:
- Keywords and filters are consistent across searches
- There are no naming overlaps or false positives, e.g., Apple the company vs. Apple the fruit
- One search isn't significantly broader or narrower than the others
Small inconsistencies here can skew results later. Adjust and re-save as needed.
Once the results look good enough, save your search. Perfection comes later.
Build Your Benchmark Report in Analyze
Build your competitive benchmarking dashboard in Analyze.
Use it to:
- Compare brands side by side
- Track defined KPIs consistently
- Create repeatable weekly, monthly, or quarterly reports
Start with the Benchmarking template, then edit the dashboard to focus on the KPIs that are relevant to your comparison.
Monitor Competitive Shifts Over Time
Benchmarking isn't one-and-done. Once your dashboard is live, watch for notable changes such as:
- Sudden spikes in competitor coverage
- Sentiment shifts
- Emerging narratives or issues
To stay informed:
- Add competitors to Smart Alerts
- Schedule a Digest Report for regular competitive media scans
- Create Monitor Streams to view competitor coverage alongside your own
Share Competitive Insights
Share your report directly from Analyze.
Industry & Market Research
Track industry trends, surface key narratives, and sharpen your messaging.
This playbook shows you how to use Meltwater to research an industry or market, identify emerging trends, and monitor important shifts over time. Before you begin, make sure you're familiar with the Brand Monitoring Playbook. Industry research uses the same foundations, with a broader lens.
Before You Build: Set Your Research Focus
Industry research starts with questions, not keywords.
Before creating your search, choose one or two questions you want this research to answer. You'll use these questions to guide your search building, results refinement, and data analysis.
Common industry research questions:
- What trends are shaping my industry right now?
- Which companies or brands are gaining attention?
- What new technologies or innovations are being discussed?
- How is my brand showing up in the broader industry conversation?
- Who is influencing this space?
- Which publications or outlets are driving the conversation?
- How does sentiment toward the industry appear to be shifting?
You don't need to answer everything at once. Start with one or two questions that support your current research goals, whether that's planning, messaging, thought leadership, or staying informed.
Create an Industry Search
Open the AI Search Assistant and select Create Industry Search.
This gives you a strong starting point without manually building a complex query.
Once the results look good enough, save your search. Perfection comes later.
Refine for Industry Signal
Industry searches are broad by design. Refinement is how you separate the wheat from the chaff.
Focus on improving relevance:
Identify and filter to top industry or trade publications
Creating Author Lists to track key opinion leaders
Exclude consumer noise or unrelated contexts
The goal is a reliable industry view, not maximum volume.
Identify Trends and Talking Points
Once your search is ready, shift from collecting mentions to making sense of patterns.
Revisit the research questions you defined earlier and use them to guide your analysis or prompt AI-powered research.
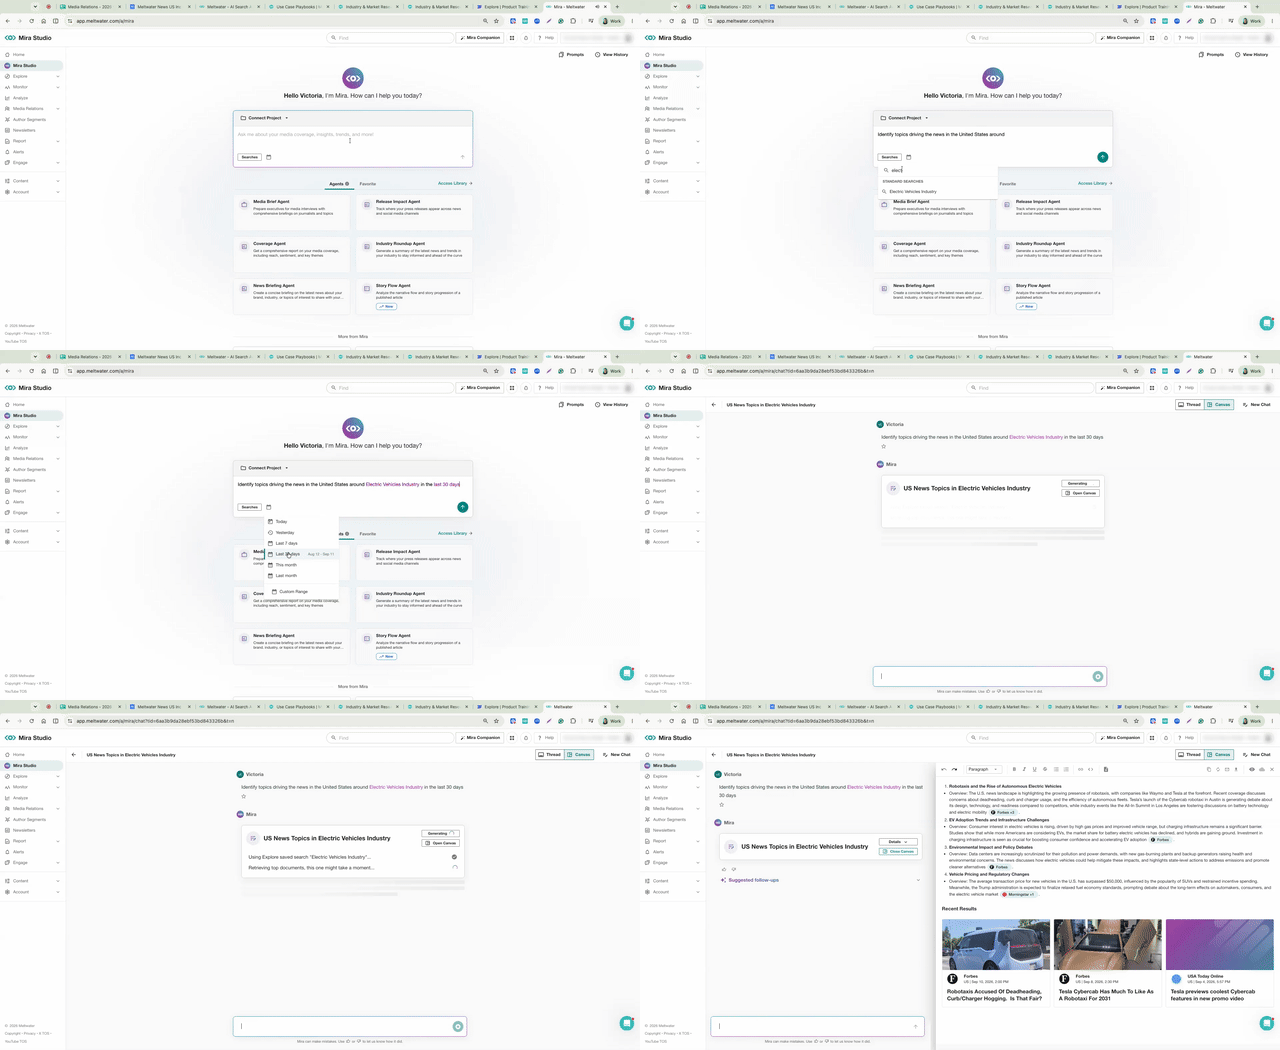
Monitor Industry Shifts & Events
Industry research is an ongoing endeavor. Set up monitoring to catch important changes:
- Use Smart Alerts to flag sudden spikes or shifts
- Schedule Digest Reports for regular industry scans
- Create Monitor Streams to keep industry coverage visible day to day
Check out the Monitoring Daily Media playbook:
Share and Apply Your Insights
Depending on your role, you may need to:
- Summarize trends for internal updates or leadership briefings
- Inform messaging, positioning, or thought leadership
- Support campaign planning or content strategy
Check out the Reporting & Sharing Insights playbook:
Crisis and Risk Management
Crisis readiness starts long before a headline breaks. It begins with understanding where you're vulnerable, setting up the right monitoring, and knowing how you'll respond if risk turns into reality.
This playbook shows you how to use Meltwater to proactively monitor risk, detect emerging crises, and manage issues before, during, and after they unfold.
Every crisis follows the same arc
Identify and Map Your Risk Areas
Start by identifying the vulnerabilities where risk is most likely to emerge for your organization or industry.
Work across teams if possible (PR, Legal, HR, etc.) and consider:
- Reputational risks. Public backlash, boycotts, brand trust issues
- Executive and leadership risks. Misconduct, investigations, resignations
- Operational risks. Supply chain disruption, outages, safety incidents
- Legal and regulatory risks. Lawsuits, compliance issues, government scrutiny
- Industry-specific risks. Activism, regulation changes, emerging competitors
- Partner or influencer risks. Agencies, spokespeople, vendors, creators tied to your brand
For each risk area, identify the signals you'd expect to see if risk starts to escalate:
- Keywords or phrases
- Hashtags
- Executive or partner names
- Industry-specific terms
(Optional) Use AI as an Accelerator
Use the AI Search Assistant to speed this up:
After you review the initial output, prompt:
Create Your Risk Search in Explore
Create one broad risk monitoring search that includes your brand, executives, and related entities, coupled with risk-related keywords and phrases.
This search runs quietly in the background and acts as your early-warning system.
Once saved, this search becomes the foundation for alerts, Monitor streams, and your Crisis Management dashboard.
Set Up Your Risk Command Center
This is where preparation turns into readiness.
- Set up Smart Alerts for spike detection, sentiment shift, top reach
- Create a Monitor Stream for real-time scanning
To set up alerts and streams, check out the Monitoring Daily Media Playbook:
- Create a Crisis Management Dashboard in Analyze
At this point, you've done everything you can to prepare.
Validate the Signal
Use your Monitor Stream and Crisis Dashboard to determine:
- Is this a real issue or noise?
- Is coverage accelerating?
- Who is driving the conversation?
- Which media channels are amplifying it?
Focus Your Monitoring on the Active Crisis
Once the crisis is confirmed, narrow your view.
You have two fast options. Both work and will just depend on your preferred workflow.
Option A: Apply a Custom Category to Your Risk Search
- Create a custom category for the crisis topic
- Apply and save it to your existing Risk Monitoring Search
- Use it to isolate crisis-specific coverage
Option B: Create an Active Crisis Search and Dashboard Tab
- Duplicate your Risk Monitoring Search
- Apply crisis keywords to create a focused crisis view
- Create an Active Crisis tab on your Risk dashboard
Monitor Continuously
During the crisis:
- Track sentiment and volume trends in your dashboard
- Track which outlets, journalists, or influencers are driving reach
- Monitor how narratives evolve over time
Your dashboard should reflect what's happening right now.
Review and Report
Finalize the Dashboard
- Summarize coverage volume and sentiment over time
- Identify peak moments and turning points
- Prepare context and narrative notes
Share findings with stakeholders.
Capture Learnings
Before closing the loop, document:
- What was the earliest signal that risk was escalating?
- Which channels and sources drove the most impact?
- Which alerts helped us act quickly, and which didn't?
- What keyword changes should become part of our standard risk setup?
- What should we add or adjust for future risk monitoring?
Campaign Monitoring
Campaign monitoring isn't just a post-campaign exercise. It starts before launch, runs in the background while the campaign is live, and comes together when it's time to report results.
This playbook walks you through how to set up campaign monitoring, stay on top of performance as it unfolds, and report results once it's over.
Prepare Your Campaign Inputs
Confirm Your Setup:
- Decide which media channels you need to track: news, social, broadcast, or a specific mix
- If the campaign includes social, confirm your social accounts are connected under Account. Connecting your social accounts for listening
- If you are also reporting on owned social performance, connect your Owned Connections. Engage and Social Analytics users only. Connect your owned social accounts
Gather What You'll Track:
- Core keywords, hashtags, and campaign-specific phrases
- Journalists, influencers, or partners involved
- A press release or announcement link (if available)
Build Your Campaign Search
Create one search per campaign if you are running multiple campaigns simultaneously.
Use the AI Search Assistant (recommended)
If you already have a press release or announcement, prompt the AI Search Assistant with something like:
Follow the prompts, then save the search.
Or build manually
- Use a keyword search for simple hashtag-led campaigns
- Use an advanced (Boolean) search for complex campaigns with multiple keywords, partners, or exclusions. Use the Campaign Monitoring Boolean Search guide to help with your build
Once saved, this search becomes the foundation for alerts, Monitor streams, and your Campaign Monitoring dashboard.
Pre-Launch Noise Check
Before launch, do a quick scan to catch obvious noise (e.g., common slang, gift guide, unrelated product names).
If you find unrelated content, add exclusions or tighten the query.
For example, if your query looks like this:
#justdoit is a common Nike hashtag, so you might adjust the query to look like this:
Using the NEAR and/or the NOT operator will tighten your results, reducing irrelevant noise. Small fixes here prevent inaccurate reporting later.
Create Your Live Tools
This is your campaign command center. Complete this last setup step, and you're ready for the launch!
- Set up Smart Alerts for spike detection and sentiment shift
- Create a Monitor Stream for quick scanning
Check out the Monitoring Daily Media Playbook:
- Create a Campaign Dashboard in Analyze
Need to customize the dashboard to your campaign KPIs? See the step-by-step guide here: Analyze: Editing Your Unified Dashboard
Monitor and Iterate
- Trust alerts to tell you when to investigate
- Open the Campaign Dashboard in Analyze to understand what's driving changes. E.g., Get an alert for a Spike? Use the dashboard to identify whether the spike is real (earned coverage) or noise (bot activity, unrelated keyword or hashtag pickup)
- Use the Monitor Stream to scan coverage as it comes in
When needed, make targeted edits in your Explore search:
- Too much noise? Add exclusions
- Missing coverage? Add keyword variants
Common alert triage:
- Mentions Spike Detected. Check top articles, sources, and authors, determine if this is a campaign lift or emerging risk, escalate if high-impact
- Influencer Pickup. Validate reach and engagement, log in your campaign notes
- Sentiment Shift Detected. Identify sources or authors, assess impact, prepare response
Finalize and Share Results
Capture Learnings
- What messages, themes, or assets drove the strongest pickup?
- Where did coverage and engagement peak?
- What noise or gaps did we catch mid-campaign?
- Which alerts and dashboard widgets were most useful?
- What should we reuse or adjust for the next launch?
Finalize the Dashboard
- Adjust the date range to the campaign start and end date
- Remove or add widgets that highlight outcomes tied to campaign goals
- Prepare context and narrative notes
Share results
- Share a live dashboard link, export PDF or PowerPoint, or Add to Google Slides
Media Relations: From Strategy to Earned Impact
Plan and execute a Media Relations campaign that earns relevant coverage and demonstrates its impact.
Successful media relations doesn't start with a journalist search or an email draft. It starts with knowing your goal, why your story deserves attention, and who needs to hear it. Use this playbook to move from strategy to journalist research, outreach, coverage tracking, and reporting. By the end, you'll have a repeatable process you can use for your next campaign.
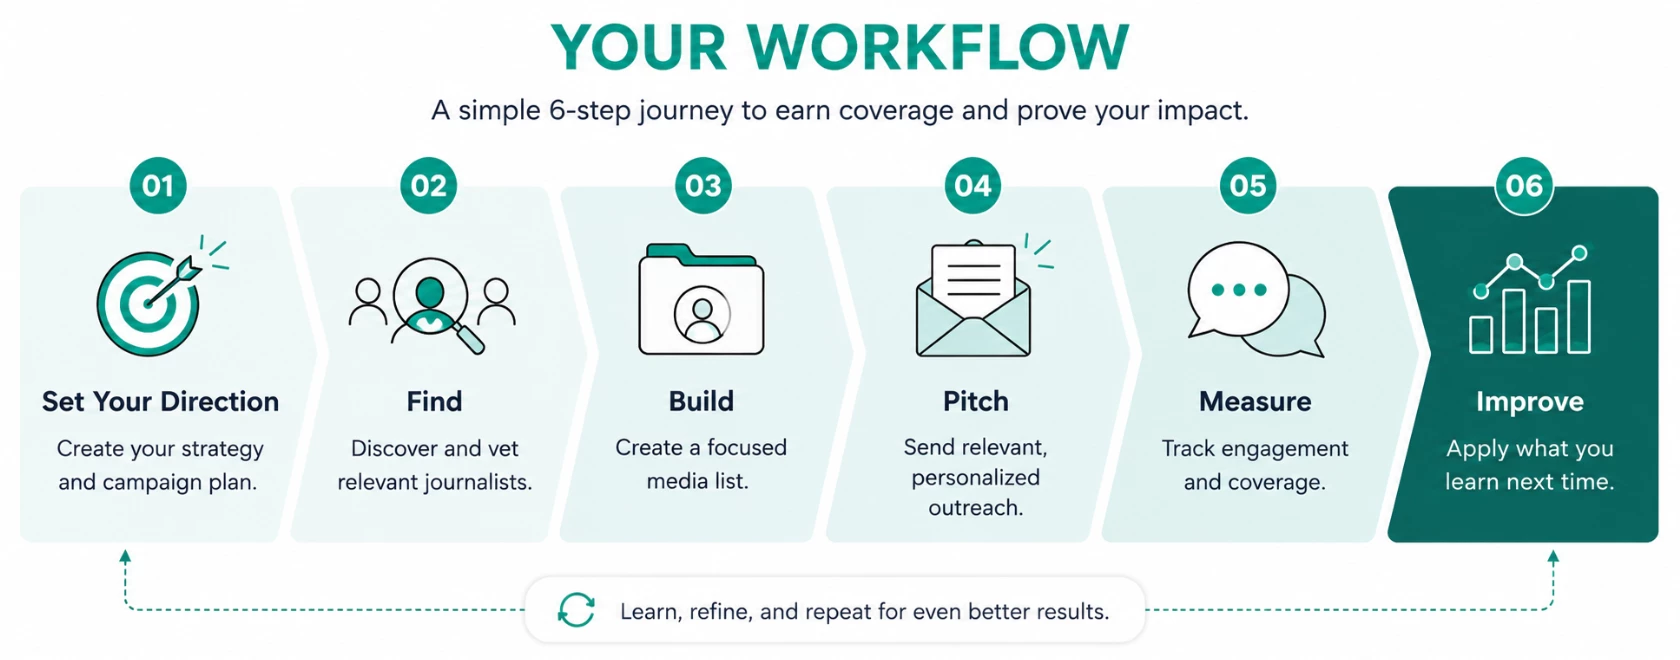
Before You Begin: Set Your Direction
Start with the outcome, not the database.
Knowing what you want to accomplish makes every decision that follows easier, from who you pitch to how you measure success.
Your media relations strategy sets your ongoing direction. Your campaign plan applies that strategy to the specific story you're pitching. You need both to create an effective campaign.
Define Your Strategy
Your strategy should answer: What role should earned media play in helping your organization achieve its goals?
You don't need a 30-page strategy to get started. Use the Media Relations Strategy Worksheet to create a quick strategy snapshot.
Need additional help building your strategy?
Turn Strategy Into a Campaign Plan
Get clear on these four things before you start searching for journalists or drafting your pitch:
- Goal. What are you trying to achieve?
- Audience. Who are you trying to influence?
- Story. What do you want them to know, and why now?
- Success. What would a good result look like?
Prepare Meltwater for Outreach
Before you can message a journalist from the Meltwater platform, you will need to set up your email with Media Relations. Choose the sending method that fits how you plan to pitch:
Find the Right Journalists
Find contacts who have a reason to care about your story.
Start With Your Story
Use your campaign plan to guide your search:
Then use Media Relations Search to discover relevant journalists and outlets.
Check the Fit
Before adding a journalist, check them for story-fit:
If you can't easily explain why you're pitching them, keep looking.
Build Your Targeted Media List
Turn your strongest-fit contacts into a campaign-ready list.
Create Your Media List
Add the journalists you've vetted to a media list organized around the story you're pitching.
Bring Existing Contacts into Meltwater
Already have trusted contacts in a spreadsheet or another system? Import them into Meltwater so established relationships can live alongside newly discovered contacts.
When imported contacts are matched to Meltwater's media database, you can also keep those relationships current with Contact Update Alerts, which notify you when journalists change roles, outlets, or contact details. This means less manual list maintenance and fewer outdated contacts when it's time to pitch.

Pitch with Purpose
Make it easy for the journalist to understand why they're receiving your pitch.
Think like a Partner
Put yourself in the shoes of the journalist receiving the pitch: Why am I receiving this? Why this story? Why now?
Learn from industry expert Nicolette Addesa on how to approach journalists as partners, tailor your pitch to what matters to them, and build stronger media relationships.
Build and Send Your Outreach
Use your research to personalize the pitch, keep the story clear and concise, and make the next step easy for the journalist.
(Optional) Manage Replies in Meltwater
If you sent your outreach via Integrated Email, manage threaded journalist replies alongside your outreach activity.
Measure the Impact
Move beyond "Did they open it?" Use your results to answer:
Did They Engage?
Use outreach metrics to understand how journalists responded to the pitch.
Did the Story Earn Coverage?
Review likely pickups and confirm coverage connected to your outreach.
Look at the bigger story
A confirmed pickup connects an article to a specific outreach. To understand how the story traveled across the media landscape, use:
- Explore or Monitor. Track your announcement, spokespeople, key messages, campaign terms, and related coverage.
- Analyze. Examine broader patterns such as coverage volume, sources, reach, geography, or sentiment.
Did it Support the Goal?
Now, go back to the campaign plan you created at the beginning to compare the results with the outcome you defined before the campaign:
- Did priority outlets cover your story?
- Were your key messages accurately portrayed?
- Did you reach the intended audience?
- Did the story gain attention beyond the contacts we pitched?
- What evidence shows progress towards your original goal?
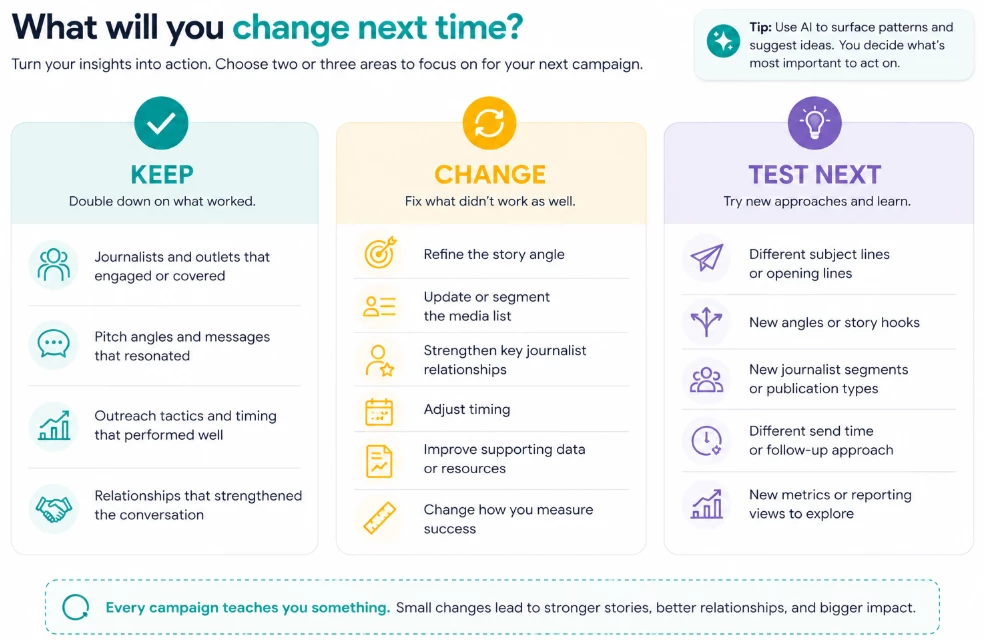
Learn and Improve
Use the results from this campaign to make the next one better.
What worked?
- Which journalists and outlets engaged and/or covered the story?
- Which pitch angles or messages appeared to resonate?
What didn't?
Look for friction. Where did relevance, targeting, messaging, or timing fall short?
What will you change next time?
Choose two or three actions for the next campaign.
Looking for More Training or to Get Certified?
GenAI Lens: AI Visibility Monitoring Setup
You can't optimize what you can't see. And in AI, visibility is everything.
Your prompts and monitoring setup directly shape what you learn. Done well, this becomes a reliable system for tracking how AI represents your brand. Done poorly, you get noise. This playbook walks you through building a setup in GenAI Lens that produces clear, actionable visibility into how your brand, competitors, and industry show up in AI responses.
AI perception tracking, not keyword monitoring
You're setting up a monitoring system that helps you understand:
- Where your brand appears in LLM responses
- How your brand, products, and executives are described
- How your brand compares to your competitors
Plan Your Monitoring Strategy
Before writing prompts, get clear on what you want to learn.
Start with questions someone might ask an AI:
- Is [your brand] good/ethical/sustainable?
- Best alternatives to [your brand]
- Top [industry category] tools
- Is [your competitor] better than [your brand]?
If it sounds like something someone would type into ChatGPT or Perplexity, you're on the right track.
Think Like Your Audience
- What would a buyer ask before choosing our brand?
- Who do we get compared to most often?
- What would someone ask when choosing between us and a competitor?
- Where should we be showing up, but might not be?
If your prompts don't map to real decision moments, they won't give meaningful insight.
Need Help Getting Started?
If you're stuck, you can use your preferred AI assistant to generate ideas:
Use this as a starting point, then refine the prompts before adding them to GenAI Lens.
Create Your Prompts
In GenAI Lens, you'll start by creating one prompt, then expand from there.
After clicking on Create a Prompt, you'll see the 3-step workflow:
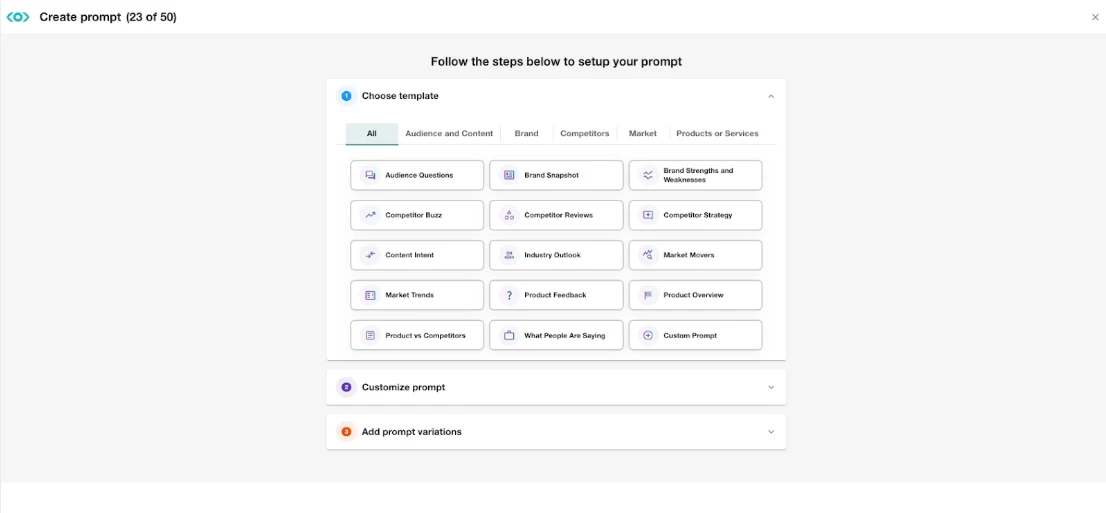
You can either choose from the available templates or create your own custom prompt based on your questions defined in Step 1. Templates can help you get started faster, but they should still be reviewed and refined to match your goals.
Start with one strong prompt
Choose from a template or one of your questions from Step 1 and turn it into one of these:
- A branded prompt (mentions your brand)
- What do people think of Spotify?
- How does Spotify compare to Apple Music?
- An unbranded prompt (mentions your category/industry but not you specifically)
- What are the best music streaming platforms?
Branded prompts help you understand direct perception. Unbranded prompts help you understand market positioning.
Customize Your Prompt
Before moving on:
- Preview the prompt
- Review and refine the wording
- Set a Target Country (if relevant)
Organize as You Go
During prompt creation, assign:
- Topic Folders → broad grouping (e.g., brand, campaign, region)
- Labels → flexible segmentation (product, risk, executive)
Setting structure early saves you from clutter chaos later. You can always edit topic folders and labels later in the Settings tab, so start organizing now and refine as you go.
Expand with Variations
Add variations to help you see the full picture:
- 1-2 additional branded and unbranded prompts
- At least one negative/inverse version of a prompt (this can be branded or unbranded)
- What are the worst music streaming platforms?
- Duplicate a prompt and add a Target Country (if relevant)
- Translate or localize your prompt to match your target country
Adding prompt variations helps you identify consistent themes in how AI responds.
Set Up Your Brand
Tailor your analysis to how your brand compares against key competitors.
Stay Organized as You Scale
As your LLM monitoring scales, structure becomes critical to staying organized.
Keep It Structured and Efficient
- Use Topic Folders for hierarchy
- Use Labels for flexible analysis
- Duplicate prompts to test variations or target countries
- Use bulk actions to clean up quickly
- Standardize naming (small detail, big impact)
A messy setup leads to misleading or inconsistent insights.
Your GenAI Lens Setup Checklist
You're ready for analysis when you have:
If any of these are missing, your view is incomplete.
Final Tip: Treat GenAI Lens as a Living System
Your GenAI Lens monitoring setup isn't a one-time task. It should evolve as often as your business and market do.
When to Update Your Setup
Revisit your prompts, topic folders, labels, and brand configuration when:
- New products or campaigns launch
- Campaign messaging changes
- New competitors emerge or gain traction
- Industry narratives shift
What to Audit Regularly
- Prompts → Are they still relevant?
- Topic Folders → Are they still structured logically?
- Labels → Are they named consistently and useful for analysis?
- Brand Configuration → Are the aliases, owned links, people, and products still accurate? Are all key competitors included?
Ready to Level Up Your LLM Monitoring Skills?
Expand on your GenAI Lens knowledge with this course:
Influencer Marketing with Klear
Four playbooks. One influencer workflow.
Building an influencer program isn't a one-time task. It's a cycle: grow your influencer community, manage relationships and campaigns, measure results, pay creators, and use what you learn to improve the next campaign. These four Klear playbooks guide you through that workflow from start to finish.
Growing Your Community
Find and activate the right influencers.
Use this playbook to discover, vet, and activate creators who align with your brand and goals.
Managing Your Network
Organize, collaborate, and run campaigns.
This playbook helps you manage campaigns, communicate with influencers, and keep relationships organized in one place.
Measuring Campaign Performance
Understand results and refine your strategy.
Use this playbook to analyze performance, share results, and turn campaign data into smarter decisions.
Pay Your Community
Manage creator payments from campaign to payout.
Use this playbook to choose your KlearPay provider, collect creator payment details, send payouts, track payment status, and manage affiliate commissions, all from within Klear.
Most teams follow this flow
Then repeat, using campaign insights and learnings to discover better-fit creators, build stronger partnerships, and improve future results.
Ready to Level Up Your Influencer Marketing Skills?
For deeper training and advanced use cases, check out these Klear Academy courses:
Happy Learning
Reporting & Sharing Insights
Turn media data into a story that supports better decisions. Monitoring tells you what's happening. Reporting is how you turn that data into a narrative that others can understand and act on.
This playbook focuses on the most effective ways teams share media insights in Meltwater and how to choose the right format for your audience. Before you begin, make sure your search is saved in Explore. If not, start with the Brand Monitoring Playbook.
Start With the Story, Not the Tool
Before choosing a report type, ask one simple question:
That answer determines how you should report. In Meltwater, most reporting falls into two clear paths.
Reporting Path 1: Shareable Dashboards in Explore
Fast, snapshot-style reporting.
Shareable Dashboards in Explore turn the insights you're already viewing into presentation-ready reports.
Think of it as capturing the story at a specific moment in time.
Use Shareable Dashboards when you need:
- A quick summary of coverage
- Slides for leadership updates
- A one-time report you can share or download
Reporting Path 2: Custom Dashboards (Analyze)
Flexible dashboards tailored to your reporting needs.
If a snapshot isn't enough, Analyze offers more control.
They require a bit more setup, but give you far more control over how the story is told and how often it updates.
Use Analyze when you need:
- Reporting on defined KPIs
- Custom layouts, widgets, and filters
- Reports tailored to different audiences
- A shareable link that stays up to date
This is the best option when reporting is ongoing, not one-and-done.
When you need to pull a report from your Analyze dashboard, click on Share and choose from the available options.
You Don't Have to Choose Just One
Explore and Analyze serve different reporting moments. Most teams use both, depending on what they're reporting on and who it's for.
Supporting Tools
These tools support reporting, but they aren't reporting paths themselves. Expand this section for quick context on where they fit.
Show content
- Exporting Data (CSV, PNG, or PDF). Export raw articles or graphs from Explore, Monitor, or Analyze for use in external tools like Power BI or Tableau.
- Smart Alerts. Notifications triggered by significant changes in your data, such as spikes in mentions or sentiment shifts. Useful for knowing when a search or dashboard may need attention.
- Digest Reports. Scheduled media scans sent from Explore. Designed for regular coverage summaries, not data visualizations.
- Newsletters (Add-On Feature). Branded media scans for internal or external audiences. Available as automated or manually curated newsletters. Best for distribution rather than analysis.
Reporting is just one part of the workflow
Ready to Level Up Your Media Monitoring Skills?
Dive deeper into custom dashboard building with Meltwater Academy:
Monitoring Daily Media
Once your search is built and saved, daily monitoring helps you stay informed with minimal effort. The goal isn't to watch coverage all day. It's to set up the right signals so important updates reach you automatically.
Before you begin, make sure your search is saved in Explore. If not, start with the Brand Monitoring Playbook.
Three tools, used together
Daily media monitoring works best when you use all three tools together. Each plays a different role:
Together, these tools make up your daily monitoring system.
Set Up Monitor Streams
Monitor Streams give you a live view of coverage as it comes in.
Use Monitor Streams to:
- Check coverage throughout the day
- Track multiple topics in one place
- Quickly scan what's new
Create Smart Alerts
Smart Alerts notify you when activity changes or spikes, so you don't have to watch coverage waiting for something to happen.
Use Smart Alerts to catch:
- Spikes in coverage
- Sentiment shifts
- High-impact mentions
These keep you informed when something notable happens, so you don't have to monitor your coverage manually.
Schedule Digest Reports
Digest Reports send a summary of coverage on a schedule you choose. These reports can be sent as infrequently as once per week or as often as twice per day.
A Simple Monitoring Routine
Here's how most teams use this workflow day-to-day:
- 1Review your emailed Digest Report when it's delivered.
- 2Glance at your Monitor Stream when you log into Meltwater.
- 3Let Smart Alerts surface changes that need your attention.
Set these up once, then let it run in the background while you focus on the insights.
Consistently monitoring coverage is just one part of the workflow
Running a PR Audit
Understand what's working, what isn't, and where to focus next. A PR audit is a snapshot in time. It helps you step back, assess performance, and make informed decisions about what to sustain, change, or stop.
This playbook walks you through a structured PR audit in Meltwater using a phased approach that mirrors how audits actually happen.
Choose Your Audit Window and Purpose
Before opening Explore, decide:
- What period are you auditing? Last quarter, last year, or a specific timeframe?
- Why are you running this audit? Strategy reset, leadership review, performance check, or planning?
- What should this audit inform? Messaging, media strategy, resourcing, or priorities for the next cycle?
Write this down. It keeps the audit focused and prevents scope creep.
Prepare Your Audit Window
Start with what you already have.
- Open your existing Brand Monitoring search in Explore or dashboard in Analyze
- Set the date range to match your audit window
- Scan results to confirm coverage looks complete and relevant
If you need to refine the results, refer to the Review, Refine, and Save Your Search section of the Brand Monitoring Playbook.
Now that your results are aligned, let's evaluate your PR activity during the audit period.
Run the Audit Read in Brand Analytics
Open your brand monitoring search in Explore or dashboard in Analyze, then set the date range to your audit window.
The goal here is to understand the baseline story of your PR performance during the audit period.
Scan the tabs to get a fast read on the data:
- Volume. When did coverage peak or drop? What moments drove visibility?
- Narrative. What themes, topics, and entities dominated the conversations?
- Sentiment. How was your brand perceived over time? Where did sentiment shift?
- Engagement. Which stories or messages actually resonated?
- Media Contacts. Which journalists drove coverage? Note: This feature requires Media Relations access
Use Mira Studio to Draft Key Findings
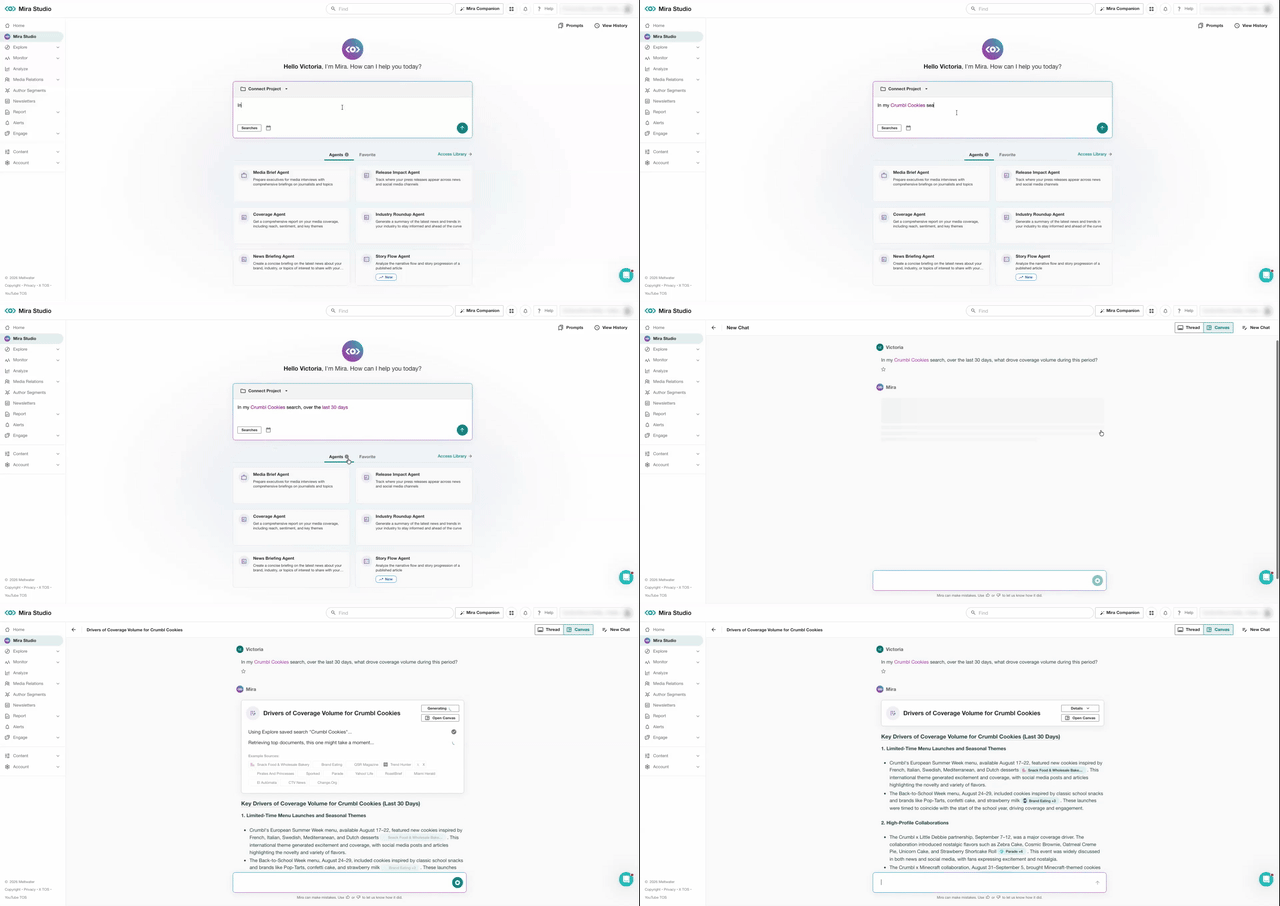
Once you've reviewed the Brand Analytics tabs, use Mira Studio to help summarize patterns and draft initial findings.
Start the prompt using your audit window and existing search. For example:
Then add one of these prompts:
- What drove coverage volume during this period?
- Which narratives or themes were most strongly associated with our brand?
- What influenced sentiment shifts?
- Which media outlets or journalists drove the most reach, and through what types of stories?
Treat the AI output as a draft. Refine with context you know from the business.
(Optional) Add Competitive, Industry, and Risk Context
Use this step to put your brand's performance in perspective. You may not need all three lenses. Add only what supports your audit goals.
Competitive Context
Use this when you need to understand how your visibility compares to peers. Review your Competitive Benchmarking dashboard to assess:
- Share of voice across mentions volume and media channels
- Sentiment compared to competitors
- Engagement trends
- Regional impact (if relevant)
This puts your performance into competitive perspective.
Industry/Market Context
Use this when you need to understand the broader conversation your brand sits within. Review your Industry/Market Research search to assess:
- Which themes or narratives are shaping the industry
- Where attention and momentum are building or declining
- How your coverage aligns or diverges from industry trends
This places your coverage within the broader industry narrative.
Risk and Crisis Context
If issues or crises occurred during the audit period, review your Risk Management dashboard to assess:
- How quickly issues surfaced
- How coverage and sentiment evolved
- Which sources or narratives amplified the situation
This highlights preparedness gaps and response opportunities.
Create Clear Recommendations
Summarize your findings:
- What approaches consistently drove credible coverage?
- Where did performance lag or fail to land as expected?
- How did narratives, sentiment, or visibility shift over time?
- What strategic shifts should guide PR efforts in the next cycle?
Focus on direction here, not description.
Share Findings from the Audit
Create a dashboard in Analyze (or use your existing Brand dashboard) to compile key visualizations that help tell your story.
- Refer to the Custom Dashboards section in the Reporting & Sharing Insights Playbook for creating an Analyze Dashboard using the Brand template
- Or create your own custom dashboard from scratch using insights from our widget catalog
When ready, share your findings with stakeholders.
Explore+ Admin & Asset Builder
Three playbooks to help you build Explore+ the right way. Explore+ works best when the environment, searches, and reporting workflows are intentionally designed from the start.
Admins and asset builders don't just add users and run searches, they shape the system that powers monitoring, analysis, and reporting across the organization. These playbooks guide you through the three core areas of building and managing Explore+ effectively.
Set Up & Govern Explore+ for Scale
Lay the foundation for a scalable Explore+ environment.
This playbook walks through defining user access boundaries, connecting the right social data sources, and establishing governance habits that keep your workspace organized as teams and use cases grow.
Build & Manage Explore+ Assets
Design searches and structure data intentionally.
Learn how to organize folders, create Custom Fields, and build Standard and Organized Searches so your Private Index stays clean and scalable.
Turn Explore+ Data into Trusted Insights
Move from signals to insights.
This playbook shows how to detect trends, validate data, and communicate insights using Discovery, Analytics, and Dashboards.
Explore+ follows a simple progression
- 1Set up the environment so the right people have access and the right data sources are connected.
- 2Structure the data by building searches, folders, and Custom Fields intentionally.
- 3Generate insights using Discovery, Analytics, and Dashboards to detect, validate, and communicate trends.
Each playbook builds on the previous one, so the structure you create early makes analysis and reporting easier later.
Ready to Level Up Your Explore+ Skills?
For additional Explore+ training, check out the Explore+ Viewer Course in Meltwater Academy:
Happy Learning
Enter your E-mail address. We'll send you an e-mail with instructions to reset your password.