

🛠️ How to Create a Dashboard Report in Meltwater Using Universal Dashboards

Whether you're new to Meltwater or just getting started with the new Universal Dashboards (UDS), building a report in Analyze might feel a little overwhelming.
Don’t worry — we’ll walk you through how to create a simple but powerful Brand Report using IKEA as an example.
Step 1: Start with a new Unified Dashboard
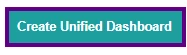
From Analyze, click Create Unified Dashboard.
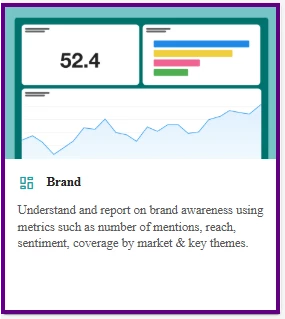
First, select a template — like Brand — then click Next at the bottom right of your screen.
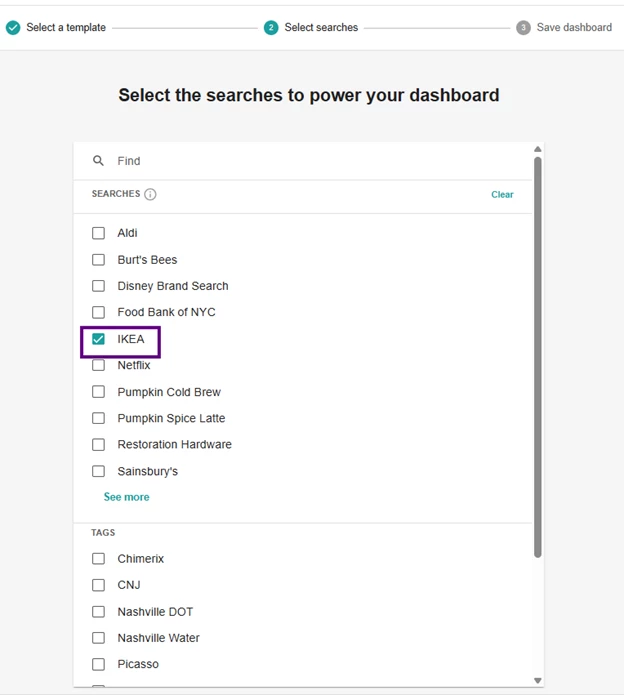
Next, choose the saved search you want to report on. In this case, we’ll use IKEA— then click Next.
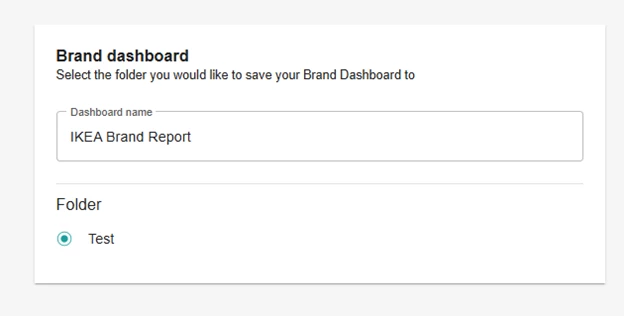
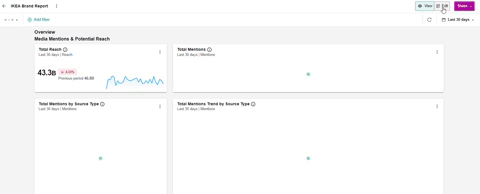
Give your dashboard a name — in this case, let’s go with, “IKEA Brand Report”— then click Create.
Step 2: Watch Your Brand Insights Come to Life
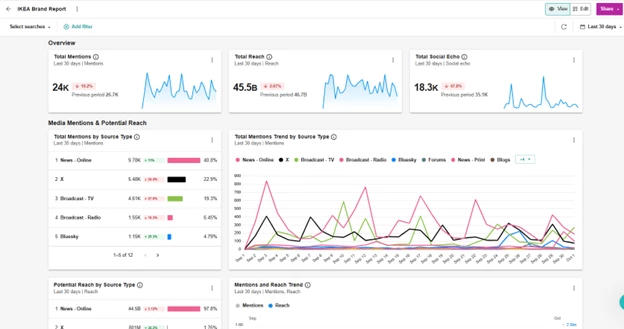
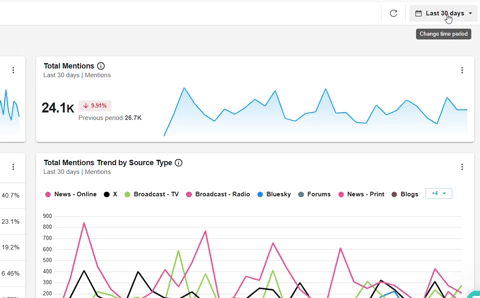
Once your dashboard loads, you’ll see data start to flow into a curated set of widgets — the most commonly used metrics for understanding brand performance and media impact.
Think of this as your brand’s pulse: Total Mentions, Total Reach, Sentiment Trends, Highlighted Coverage, Top Sources, and more — all pre-built and ready.
Take a moment to adjust:
- The date range to match your reporting period
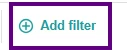
- The filters to zoom in on specific locations, source types, or sentiment
This helps tailor the report to your team’s focus — whether that’s global brand health or regional campaign tracking.
Step 3: Customize Your Dashboard Layout
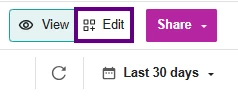
Ready to make the report your own? Click Edit in the top-right corner of your dashboard to enter edit mode.
From here, you can:
- Add new widgets
- Rename the dashboard or tabs
- Rearrange widgets to match your reporting flow
- Delete anything you don’t need
- Apply filters that will stay saved when you exit edit mode — so your view stays consistent
💡Pro Tip: Filters you apply while in Edit mode will stay saved when you exit so your dashboard view stays consistent every time you open it.
This is where your brand story starts to take shape — tailored for your audience and goals.
Not sure what each widget shows? Check out our Widget Catalog to learn what each widget type means and how it helps measure brand performance.
Step 4: Save and Share your Dashboard
Once you've finished editing, it's time to share your dashboard with your team or drop it into a presentation.
First, click View in the top-right corner to exit Edit mode — then, select Share and options will appear.
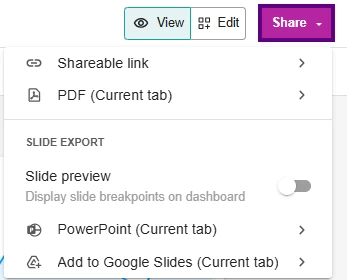
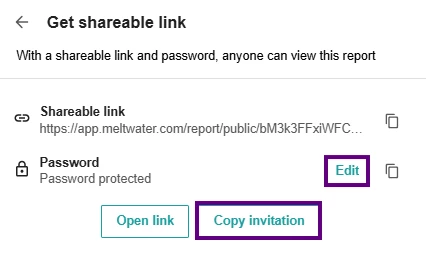
🔗 Shareable Link
Let others view your dashboard with a secure, password-protected link.
- Update Frequency: Control how often the shared data refreshes
→ Never, every 15 min, or every 30 min
- Link Expiration: Choose how long the link stays active
→ 24 hours, 7 days, 30 days, 6 months or 1 year
- Edit password: Click Edit, enter a new password, and click Save
- Click Copy Invitation to share both the link and password
📄 Export Options
Perfect for decks, reports, or presentations:
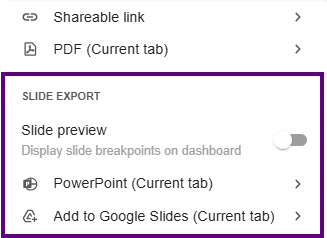
- PDF (current tab)
- PowerPoint (current tab)
- Add to Google Slides (current tab)
📌 Note: If your dashboard has multiple tabs, export each one individually by clicking Share on that specific tab.
💡 Pro Tip: Toggle on Slide Preview to see where your dashboard will break across slides — super useful for clean exports to PowerPoint or Google Slides.
🎉 That’s it! You’ve built your first brand report in Analyze
You’ve created a customizable dashboard that helps track brand performance across media channels, and you’re just getting started.
Want more hands-on help?
- Check out the Getting Started with Unified Dashboards in Analyze guide
- Join a live Core Workshop or drop into weekly Office Hours — both available on our Training Calendar