

So, you’ve started building reports in Meltwater under Analyze! Now you might be wondering:
Which insights should I add to my dashboard to move the needle when it comes to shaping a media strategy?
Whether you're prepping for a stakeholder meeting or mapping out your next campaign, your reports can help you answer key questions such as:
- Where are we being covered?
- What outlets are mentioning us and driving coverage?
- How much of our brand is positive or negative?
Here’s how to structure a report that's strategic.
🧭 Step 1: Start with a Saved Brand Search
Before building your dashboard, make sure you have a saved search tracking your brand.
Don’t have one yet? Check out our Brand Monitoring Toolkit to get started quickly.
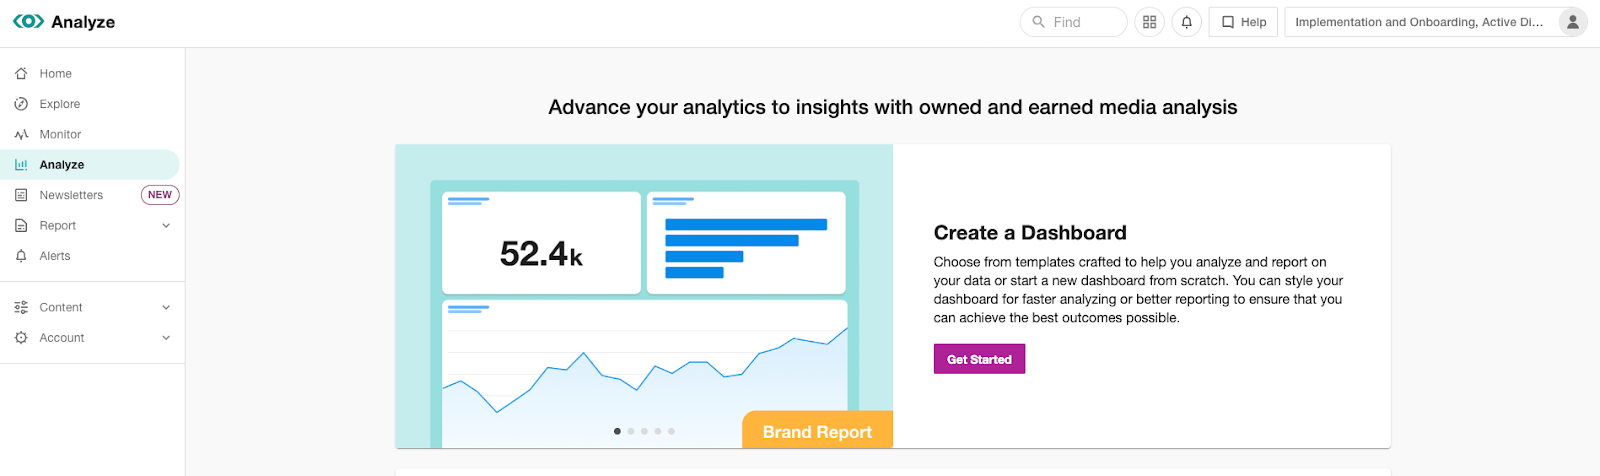
Step 2: Open Analyze and Start a New Dashboard
In the left-hand navigation bar, click Analyze to open the Dashboard Homepage.
-
Click Get Started at the top right
-
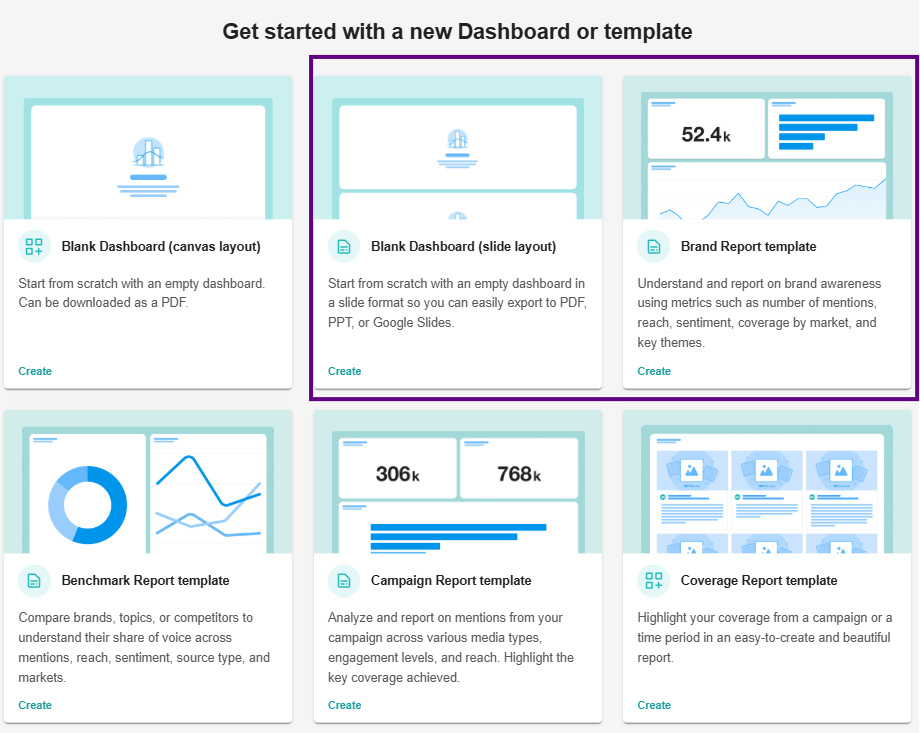
Choose the Brand Report template, it’s the best fit for media strategy, helping you track awareness, sentiment, and narrative themes.
-
Prefer to build from scratch? Select any Blank Dashboard option to choose your own metrics.
-
Now you're ready to start customizing your widgets and visualizing the metrics that matter most to your strategy.
Step 3: Start with the Basics
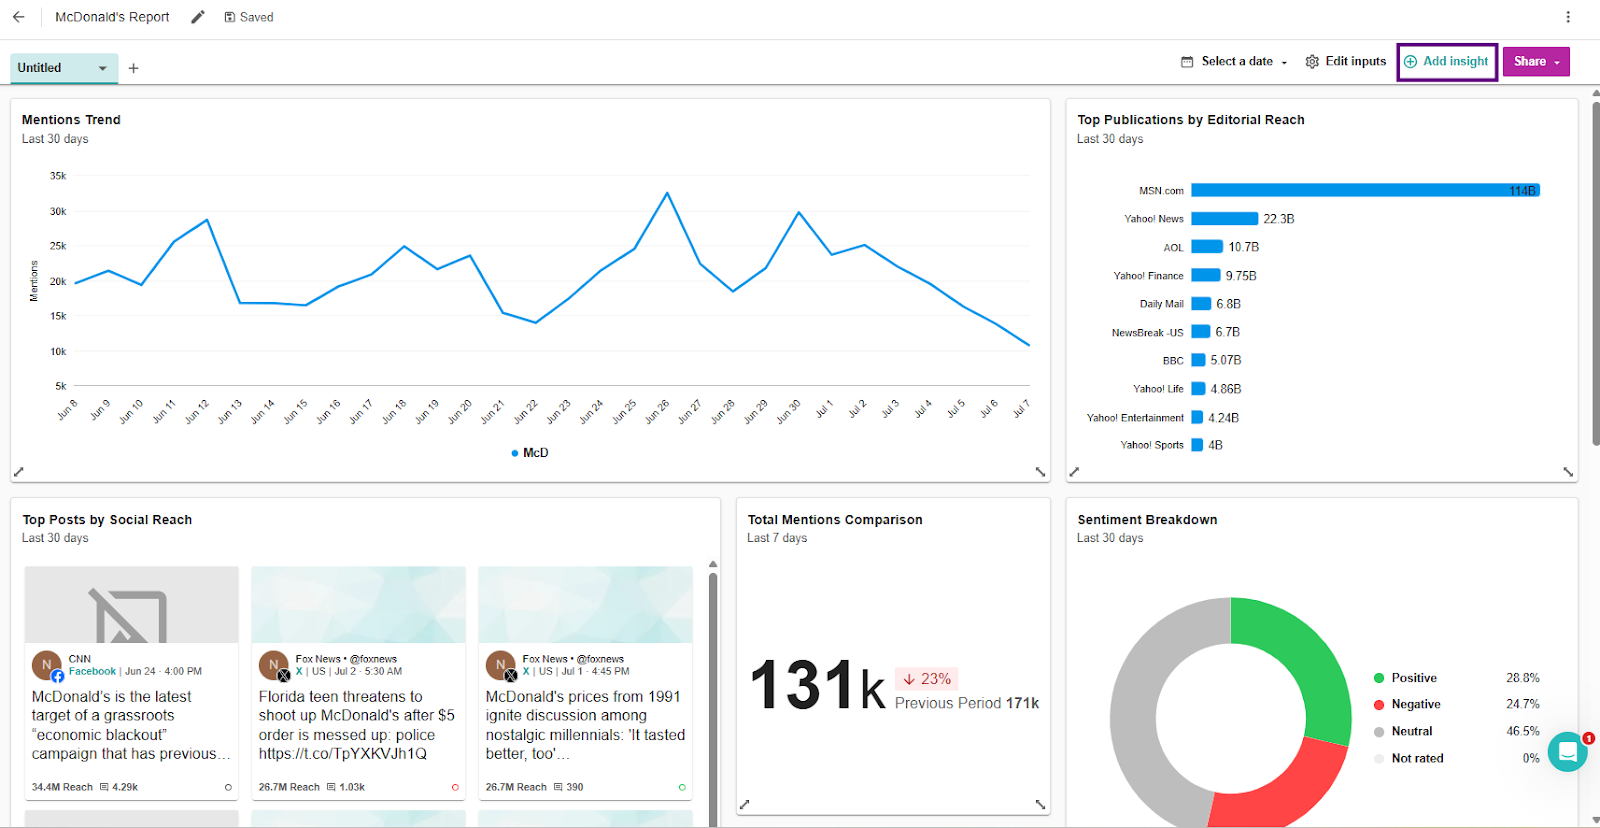
Before anything else, you need a strong pulse on what’s being said and where. Select Add insight at the top right of the slide to open the full library of metrics to report on. These are the key metrics to include in any strategy-minded report:
- Total Mentions Comparison: Shows how often your brand is appearing compared to the previous time period
- Mentions Trend: Tracks how coverage volume is changing over time
- Sentiment Breakdown: Measures positive vs. negative coverage
- Top Publications by Editorial Reach: Reveals which media outlets have the biggest footprint across your inputs
- Top Posts by Social Reach: Highlights high-performing social content that’s driving attention
Step 4: Add Strategic Insights
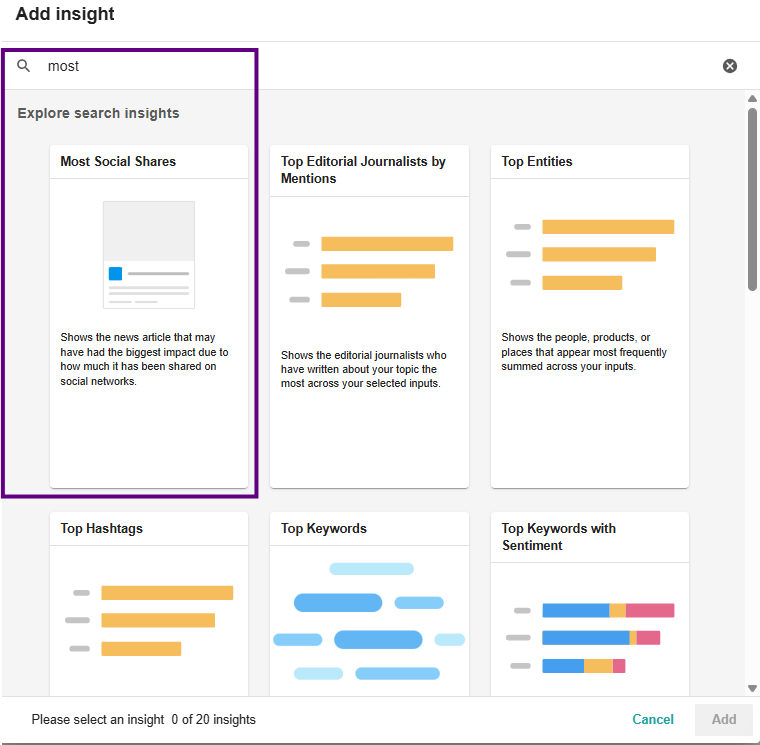
Once you've nailed down volume and tone, it’s time to dig into insights that inform where to focus your media strategy. Select Add insight and search for the below:
- Top Keywords: Highlights the most commonly used terms in your media coverage
- Top Entities: Spot common Brands or Organizations mentioned alongside your tracked keywords
- Share of Voice by Source Type: Compares how much coverage you’re getting across source types (News, X/Twitter, Facebook, Broadcast, etc.)
- Highest Potential Editorial Reach: Surfaces the individual mention with the greatest potential audience
- Highest Syndication: Highlights stories that were republished the most across outlets
- Most Social Shares: Spots the post that was shared the most on social media
Example Dashboard with all the above metrics linked here. PW: MCD2025
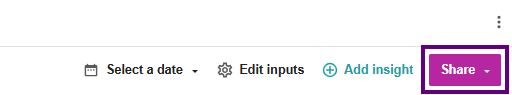
✅ Step 5: Share and Schedule
Once your dashboard is looking great (see how to customize it here), it's time to get it in front of your team or leadership!
- Click the purple Share icon at the top right to export your dashboard
- Select the option best for you (PDF, Google Slide, Interactive Link, PPT slides)
- Or click Report Scheduling to send reports automatically via email as a PDF or PPT
(e.g. every Monday at 9AM to your comms or PR team)
🎯 Pro Tip: Scheduling your dashboard keeps everyone aligned and saves you time week after week.
Want to master this in 30 minutes?
Take our Analyze Dashboards Course in Meltwater Academy and earn a LinkedIn certificate! It walks you through everything above, with real-world examples and pro tips.
💬 Have a question on a dashboard you're building or which Insights to include? Drop them below and let us work together!