



5 Easy Ways to Impress Your Boss This Week
You just got Meltwater, and now you want a simple, visible way to show your boss it's already working in your favor. Or maybe you're about to log off for the weekend and want to leave looking completely on top of things. Either way, you don't need to be an expert to pull it off.
What you'll learn: Five beginner friendly things you can do in Meltwater this week to give your boss faster answers, clearer stories, and fewer surprises. We'll follow one running example the whole way through: keeping tabs on NASA and the wider space industry. The exact same steps work whether you track a:
- Brand
- Competitor
- Campaign
- Candidate
- Cause
Swap in whatever you actually look for as you read. 😊
1. Let AI Explain Your Dashboard for You
Why you're doing this: A dashboard shows you what is happening, like mentions jumping 40% this month. Your boss wants to know why.
What to do:
- Go to Analyze and open (or create) any dashboard tracking your topic. In our case, NASA coverage.
- Hover your mouse over a widget you want explained, like Total Mentions or a trend chart.
- In the top right corner of that widget, click the wand icon (Generate widget insight with Mira).
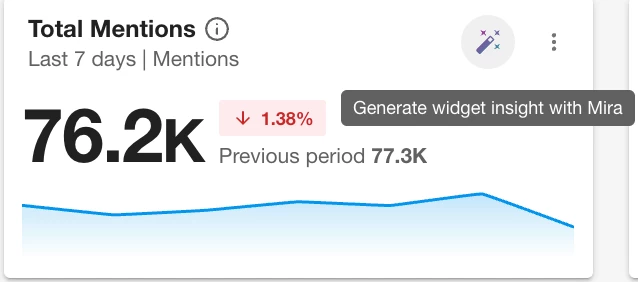
- Mira, the AI built into your Analyze dashboards, reads the data and writes a plain English summary of what's trending, what drove a spike, and how the channels compare.
- Click Add AI Insight to the Dashboard so the explanation lives right next to the chart.

The payoff: You walk into the meeting able to say:
"Mentions jumped this month, mostly driven by the Artemis II lunar flyby coverage," instead of just "the line went up."
2. Answer any Question About Your Coverage in Seconds
Why you're doing this: Leaders and Clients ask pointed questions on the spot.
"Are people talking about the new Moon mission?"
You don't want to create an Explore search every time. Two quick tools handle it, and it helps to know the difference between them.
To quickly scan (just to eyeball it):
- In an Explore search or Monitor view, open your content stream (where the articles and posts appear).
- Click the magnifying glass icon at the top and type a keyword, like "Artemis."
- This jumps you to the matching mentions in your list.
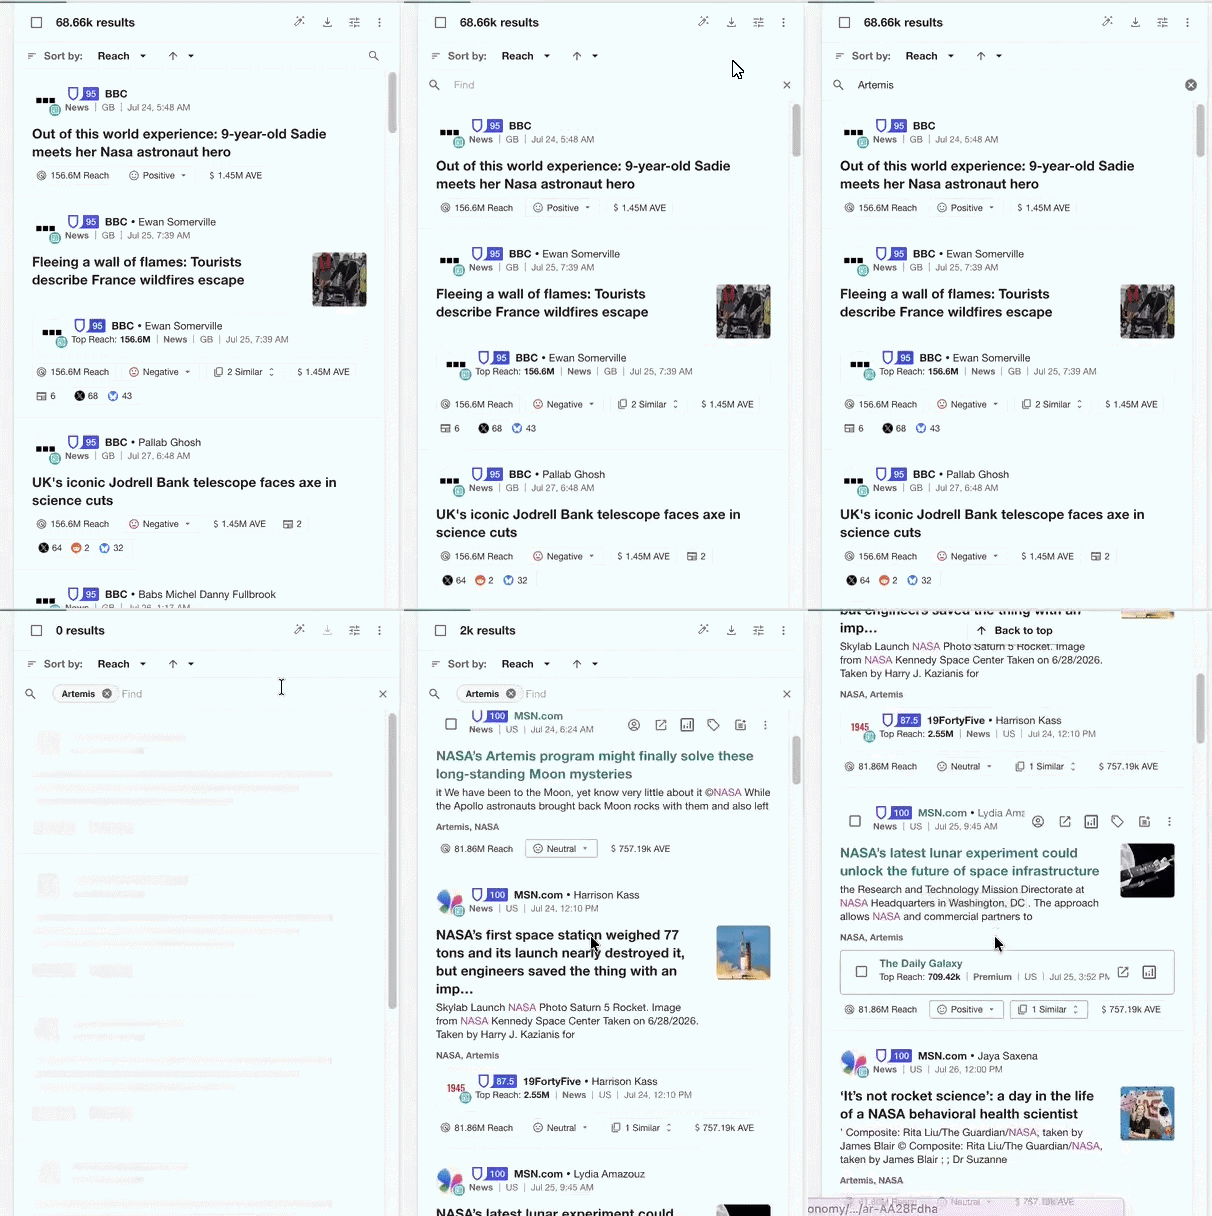
One important thing: the magnifying glass only changes the results you see. It does not change your charts or the AI analysis. Think of it as a fast way to look.
To actually analyze it (charts and AI included):
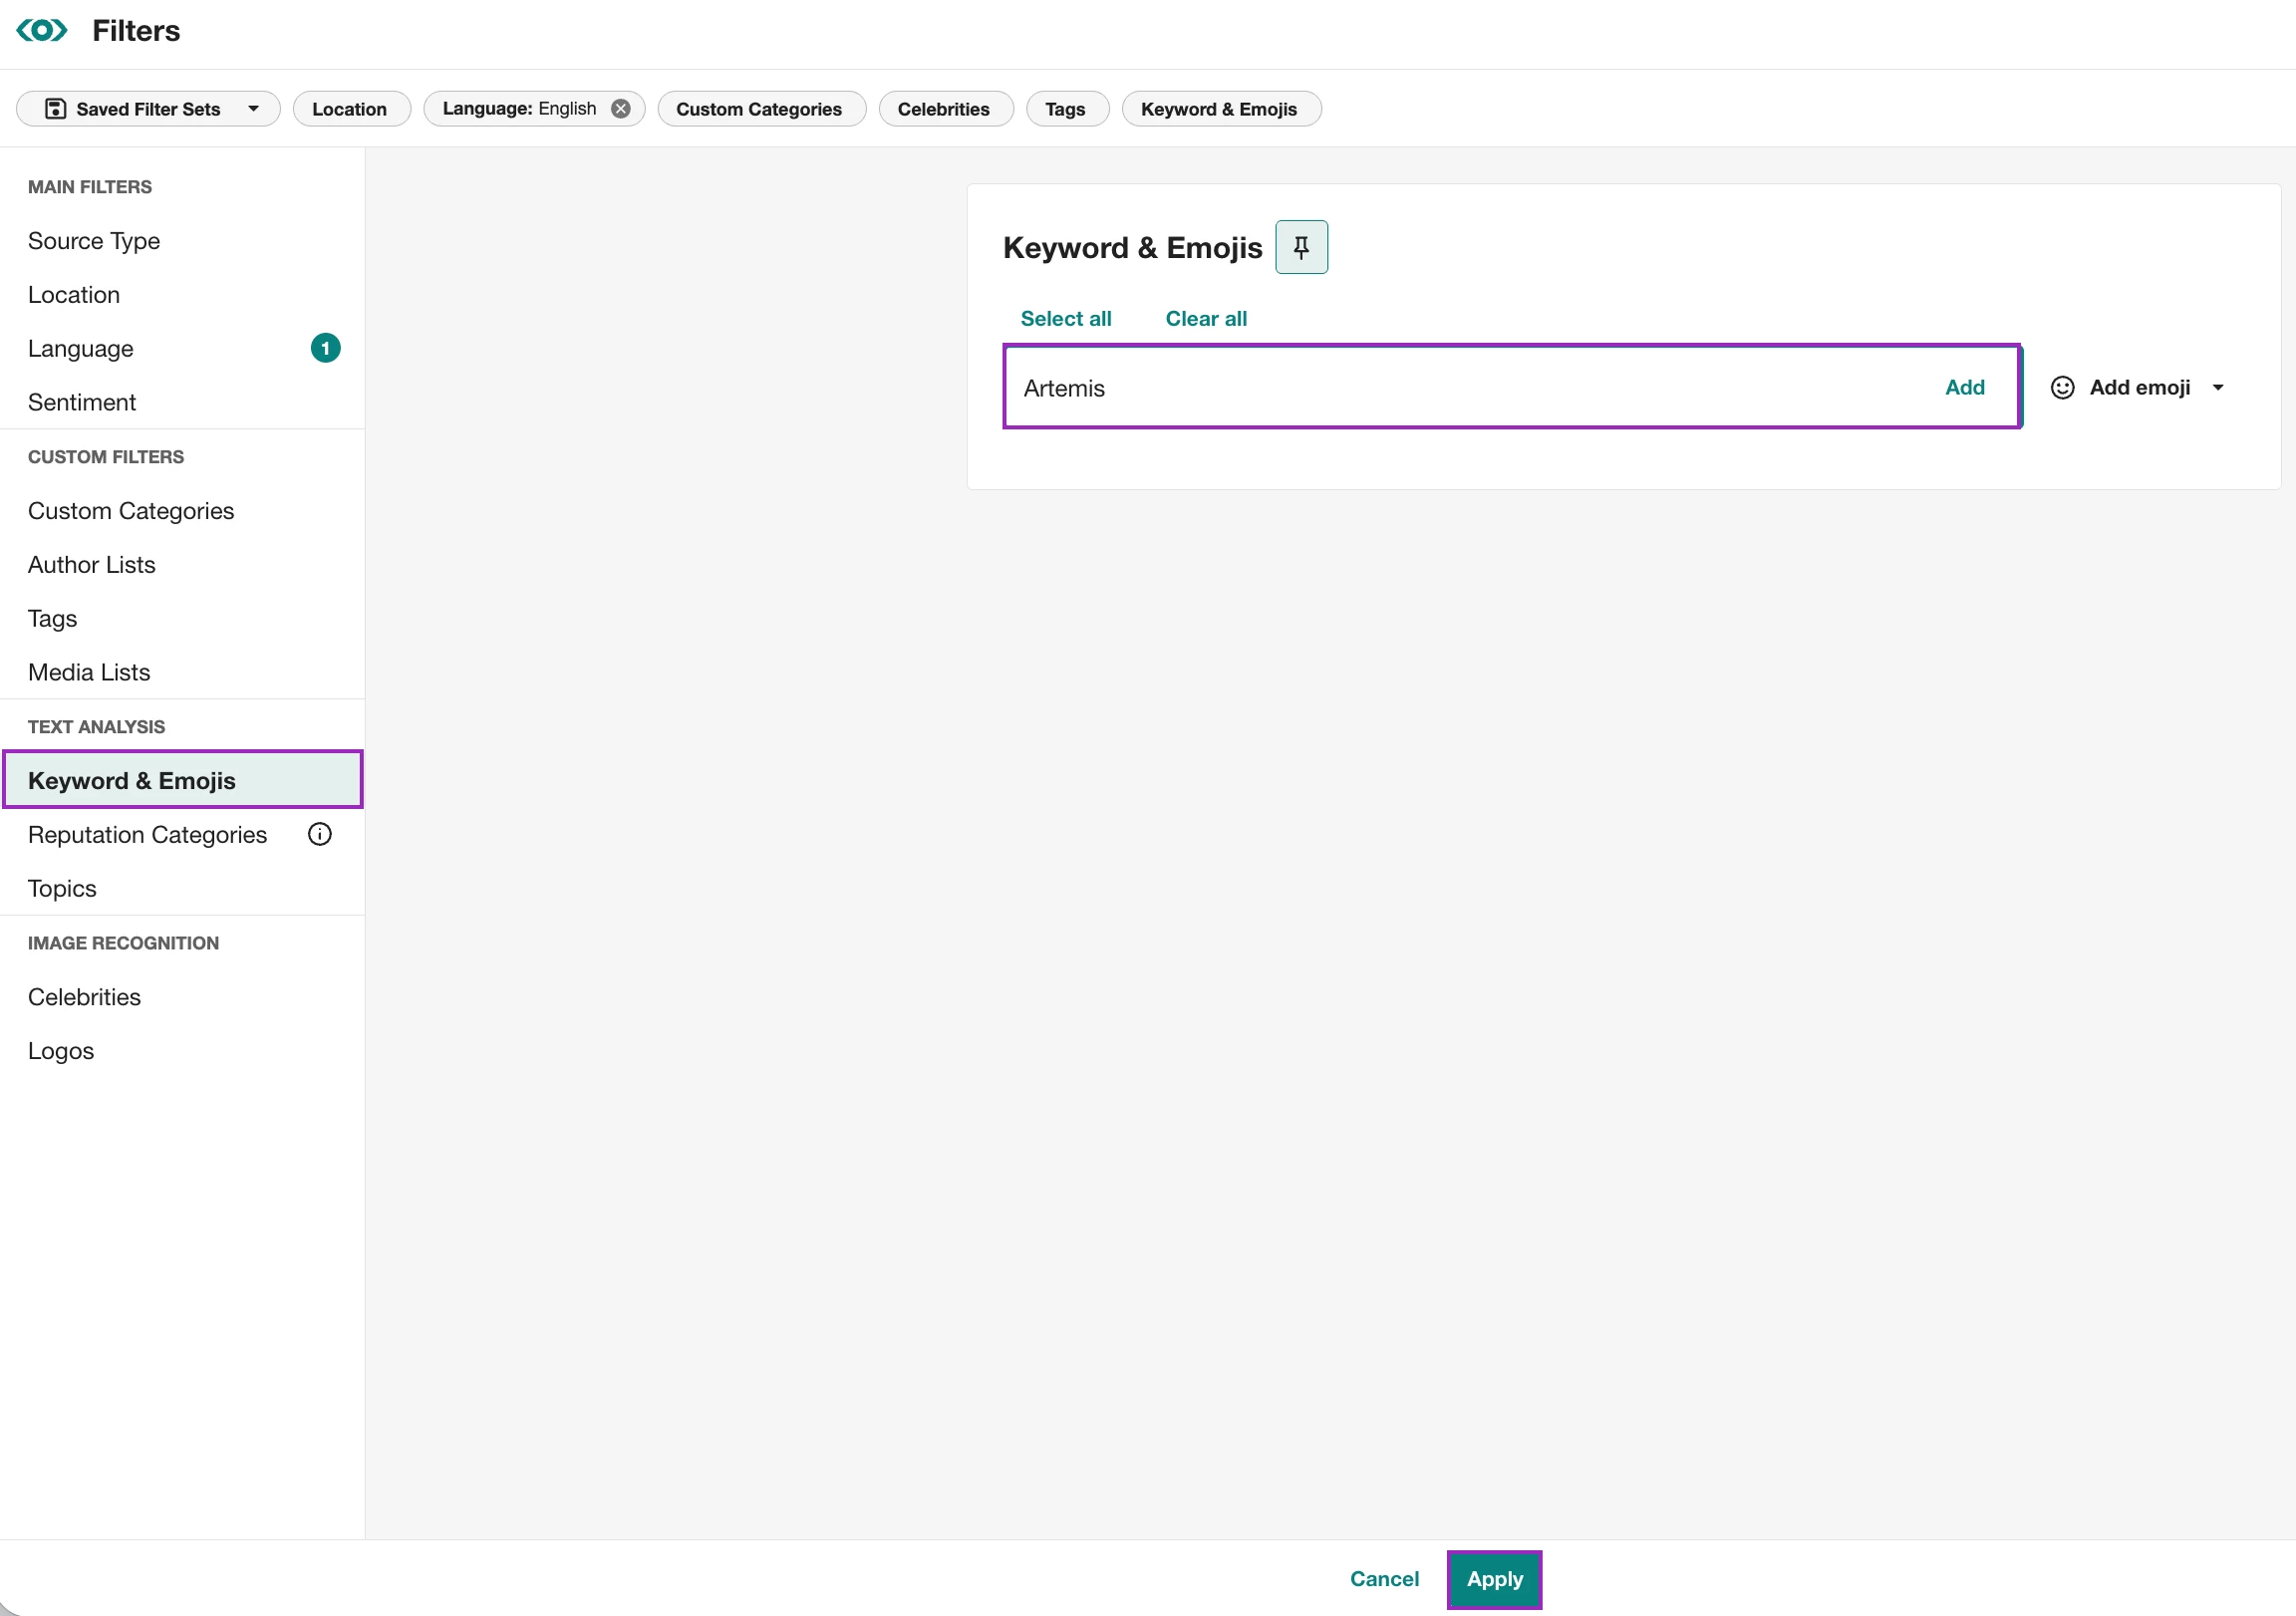
- When you want the numbers and the AI read on just that topic, click All Filters, then Keyword & Emojis.

- Add your keyword and click Apply. Now your entire view updates, including the AI Powered Insight and every chart, so you're reviewing only mentions that mention Artemis. This works in both Explore and Monitor.
- Want to reuse it later? Click Saved Filter Sets, then Save, and give it a name.
Bonus, answer "how are we doing in ___?"
The same idea works for places. If you need to know about a specific region, open All Filters, choose Location, and pick the country or region. Every insight and chart now reflects just that area.
The payoff: When your boss asks a specific question, you have a real answer.
3. Show Exactly Where You Stand Against the Competition
Why you're doing this: Leaders think in comparisons. Share of Voice shows how much of the conversation you own next to a competitor, measured by mentions, reach, engagement, or sentiment.
What to do:
- Start in Explore. You'll want one saved search per thing you're comparing (NASA, SpaceX, and ESA). Got those already? You're set. If not, ask the AI Search Assistant to build them: try "Create a brand search for SpaceX," repeat for each competitor, and Save.
- Go to Analyze and select Create Unified Dashboard.
- Choose the Benchmark template.
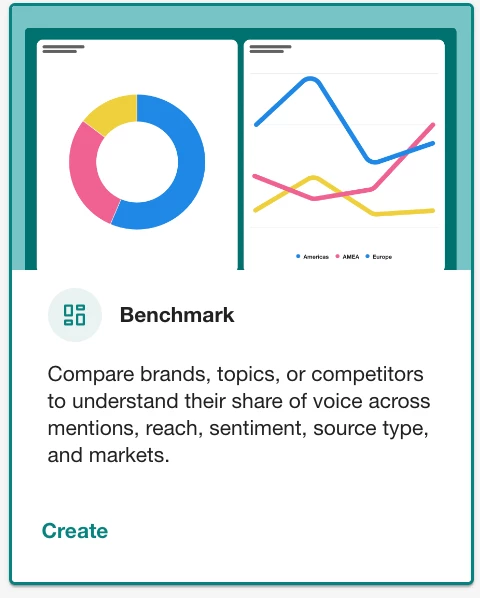
- Select your saved searches to compare, then click Next.
- Give the dashboard a name and pick a folder. That's it. The Benchmark template already includes the Share of Voice widgets for you (mentions, sentiment, engagement, source type, and a mentions trend).
Get it to your boss: Click Export and share it as a live link. They can open it in a browser and watch the numbers update on their own, even if they don't have a Meltwater login.
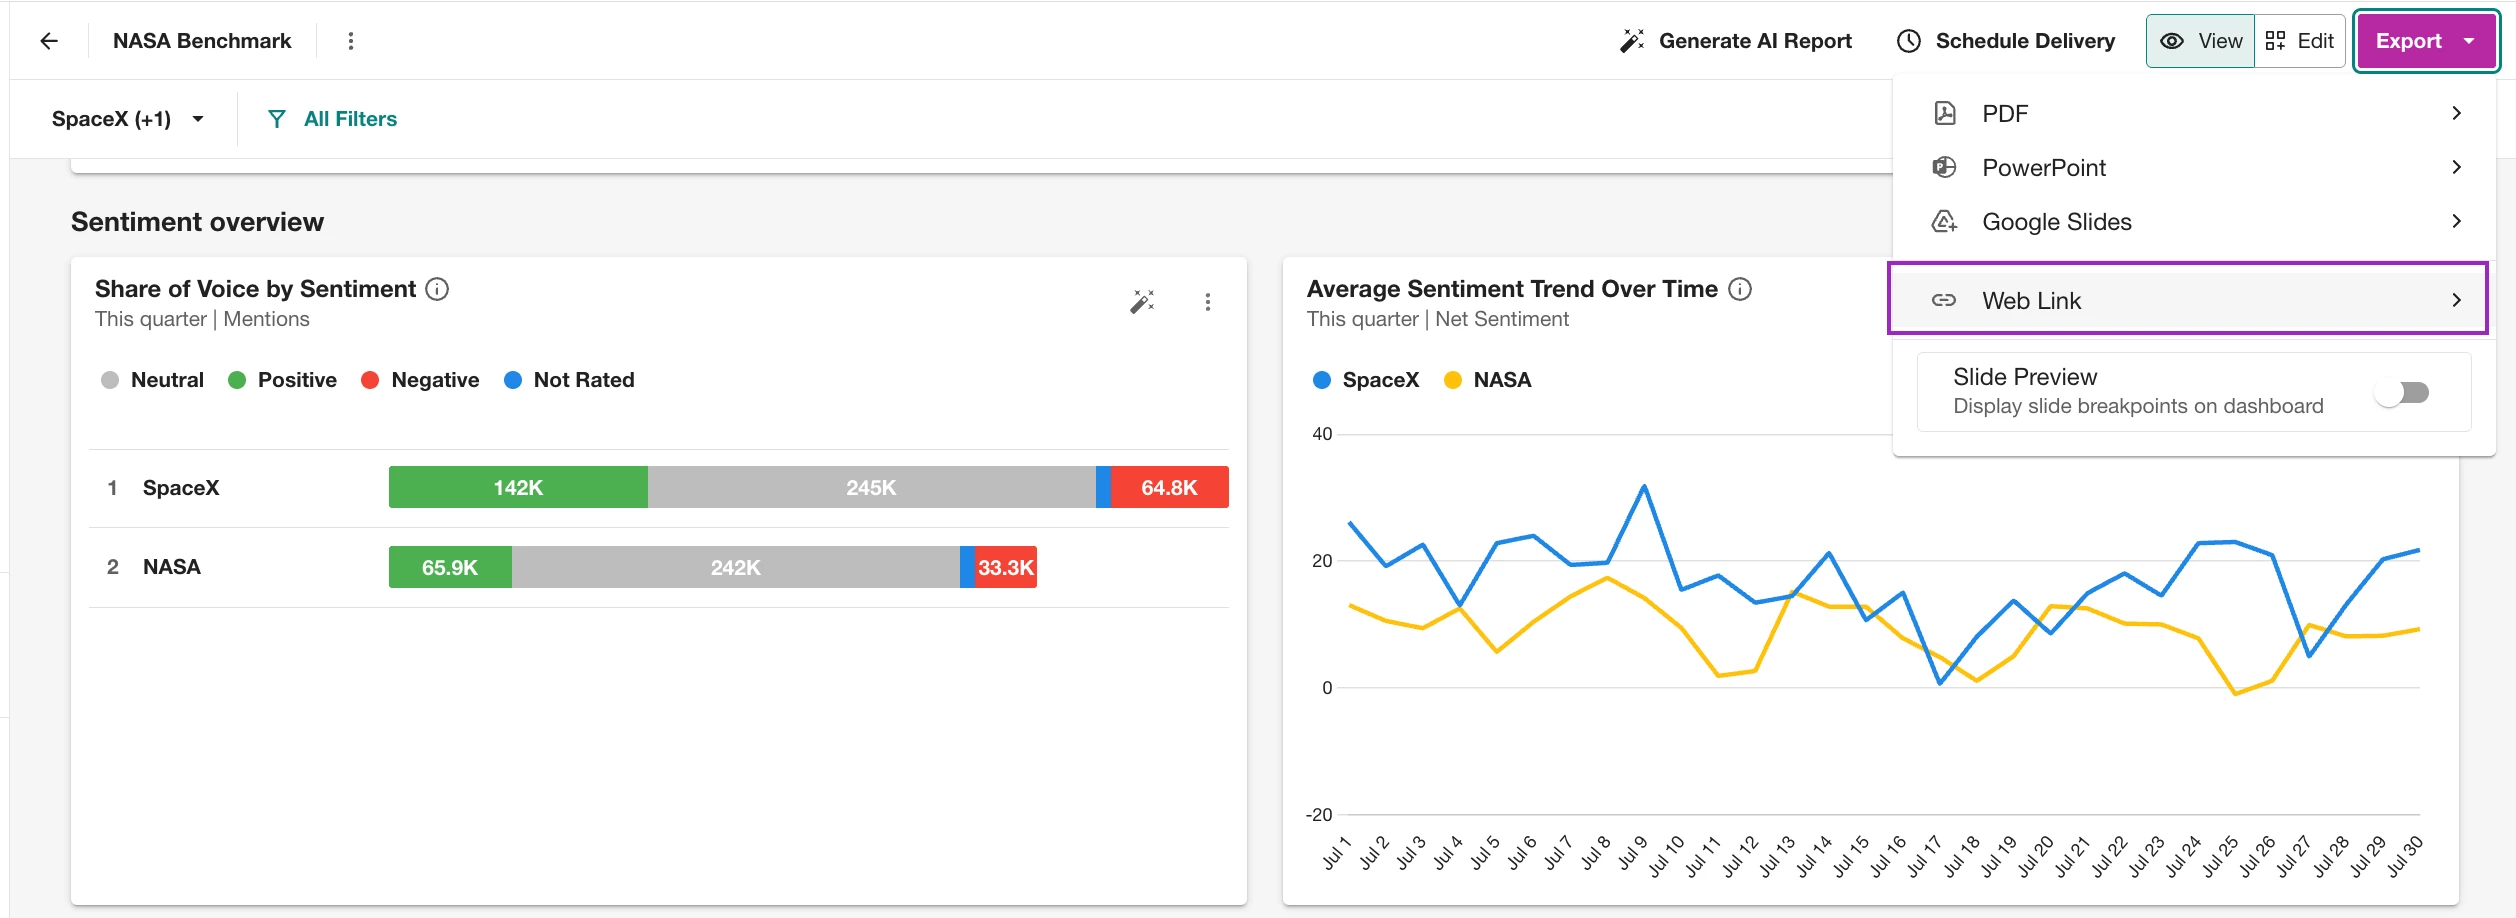
The payoff: Instead of a vague "we're doing well," you show a clean chart and say:
"We own 52% of the space conversation this month. SpaceX has 34%."
4. Get an Alert the Moment Something Hits
Why you're doing this: Bring the insights to your boss instead of waiting for them to come looking. A spike alert drops Meltwater's notification right into their email or a shared team channel.
What to do:
- Pick a topic your boss mentioned recently. Maybe a competitor's launch, a big cultural moment like the World Cup, or in our example the next Artemis milestone.
- Set up an Alert and choose Spike Detection, which triggers when conversation about that topic suddenly jumps above its normal level.
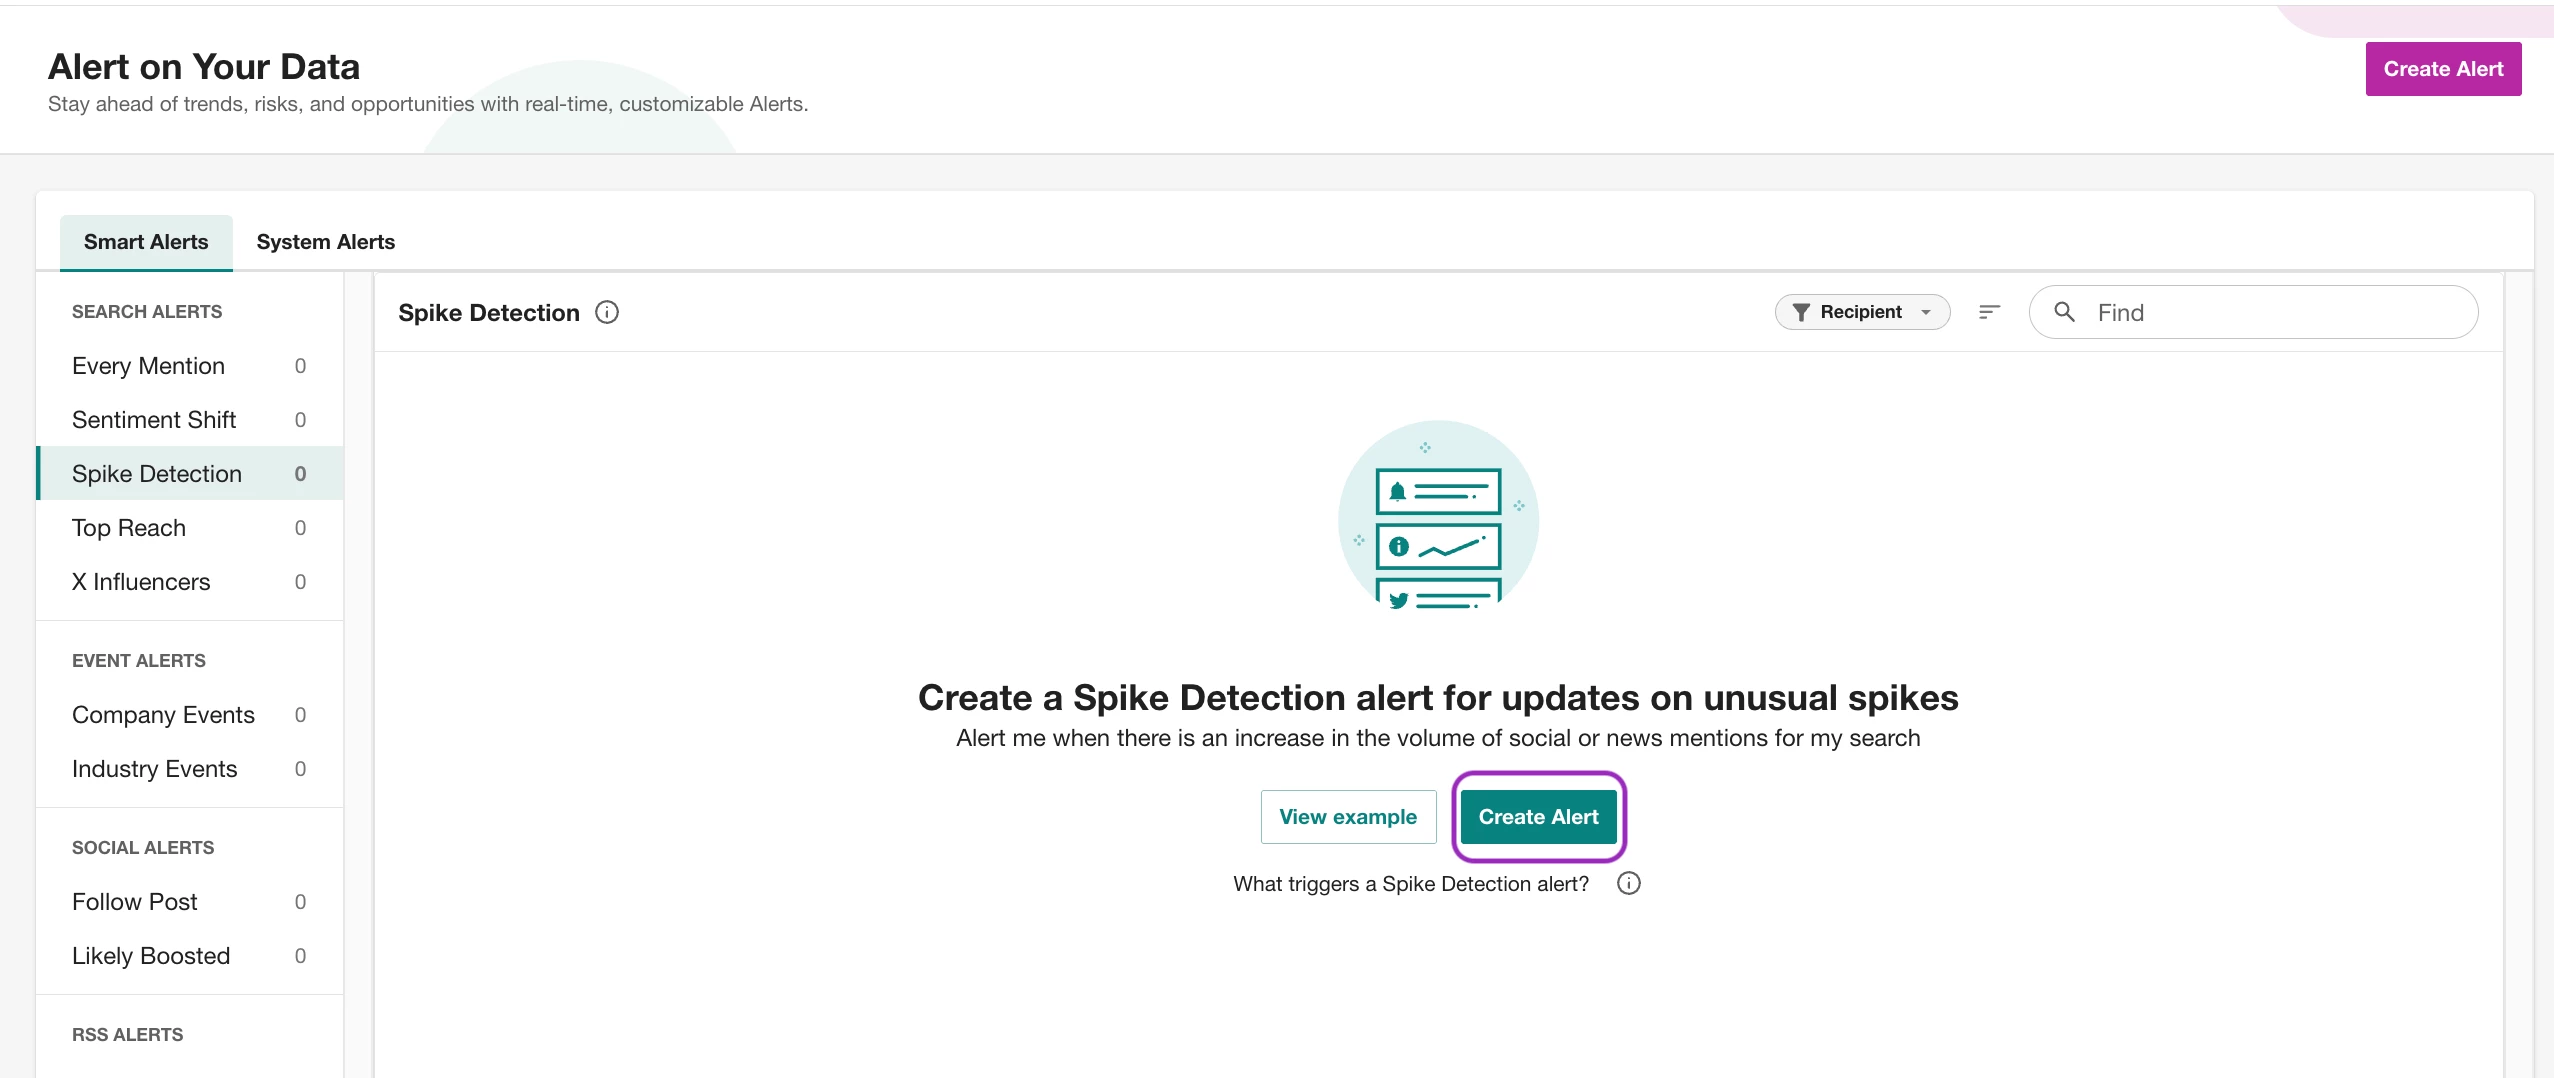
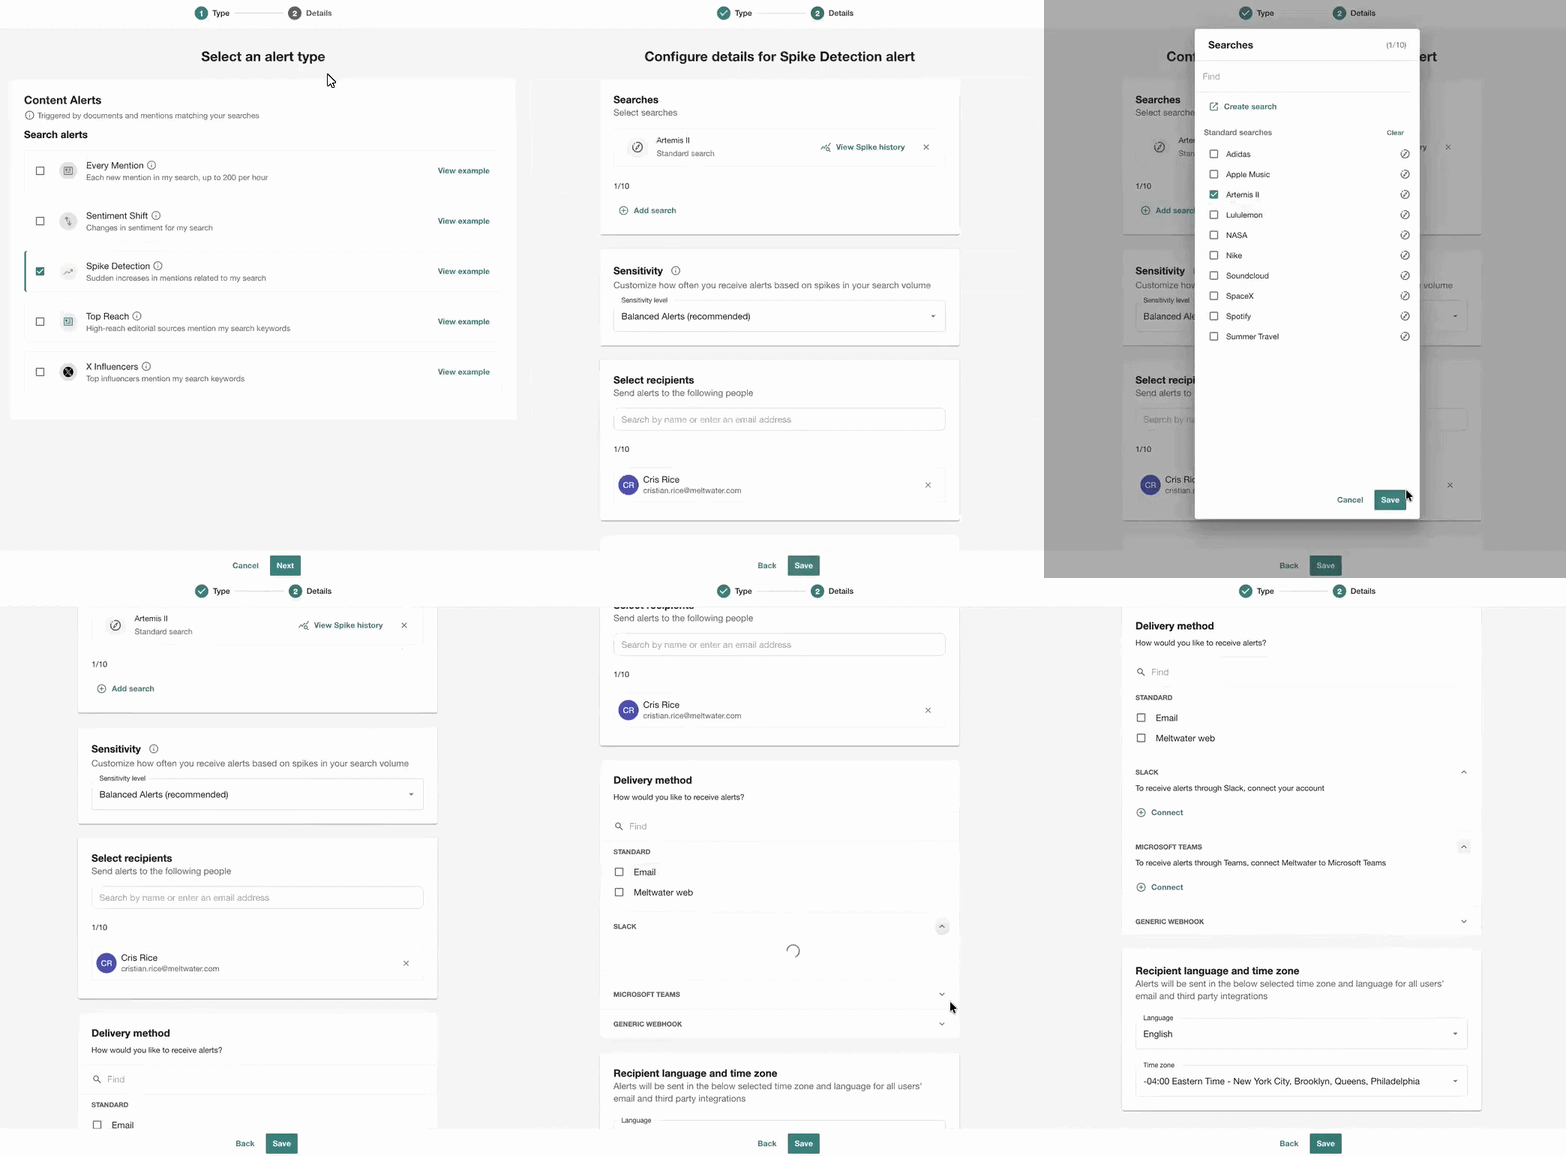
- Select the saved search that tracks your topic.
- Route the alert to wherever your boss will actually see it: their email, or a shared Slack or Teams channel your team already uses.
- Now the alert fires on its own whenever that topic spikes. No login needed on their end.
The payoff: Instead of your boss forwarding you a story and asking "did you see this?", they watch the alert land in the shared channel and realize you built the radar that caught it.
5. Turn Your Data into an Executive Summary
Why you're doing this: Raw numbers don't alone land in a presentation, but a clear narrative does. Mira Studio takes your data and writes the story for you, including comparisons, sentiment, and key themes.
Heads up: Mira Studio is a standalone product, and only some accounts have access to it. (This is different from Mira, the AI built into your Analyze dashboards back in the first tip.)
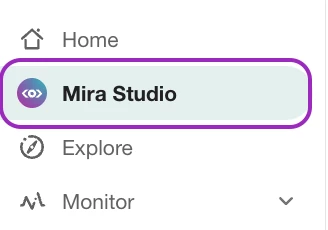
If you don't see Mira Studio and would like it, drop a comment on this post and we'll point you in the right direction.
What to do:
- Open Mira Studio and type a plain language prompt. For example: "Compare share of voice, sentiment, and key themes for NASA, SpaceX, and ESA over the last three months."
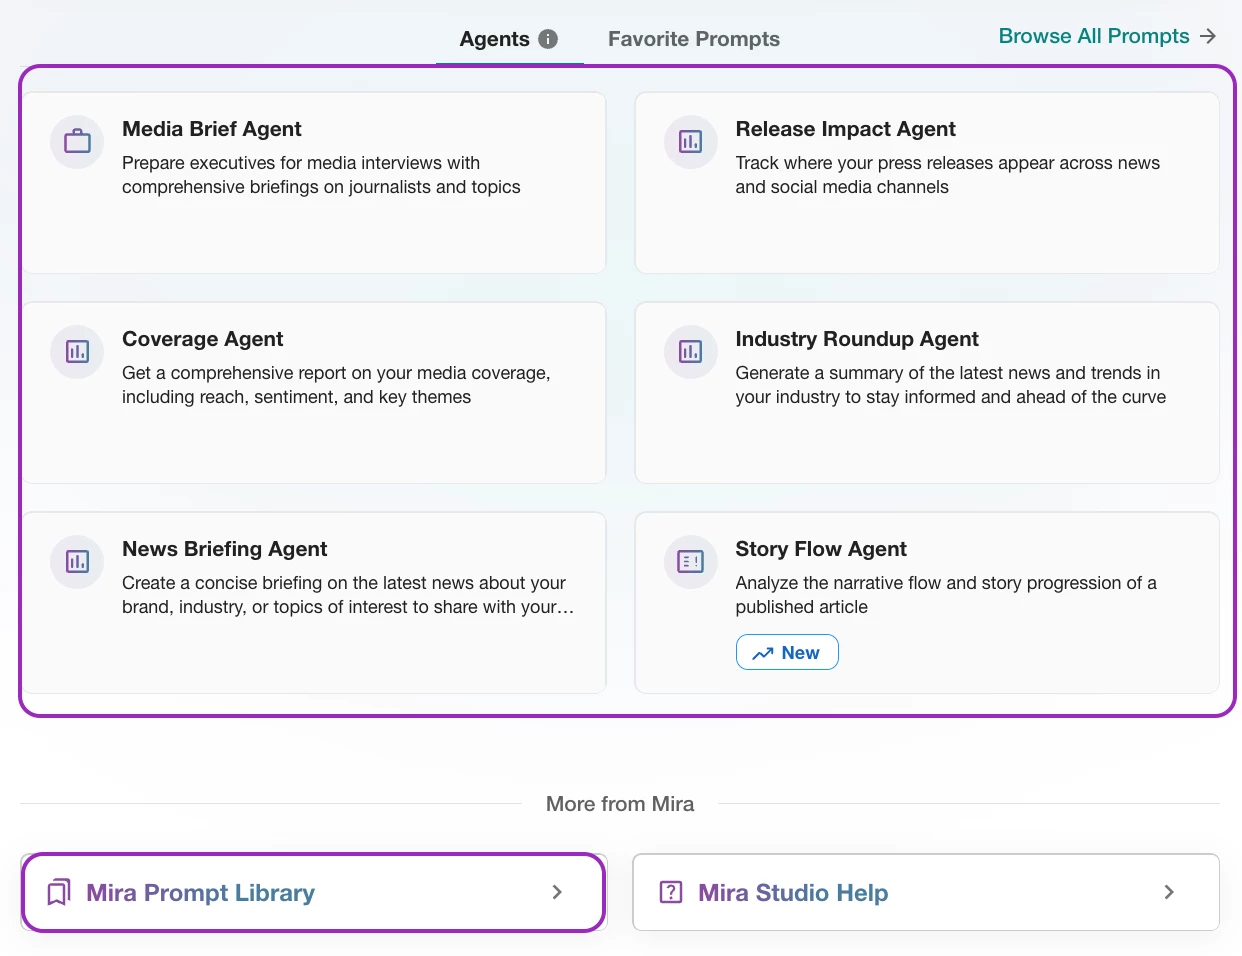
- Not sure what to ask? You don't have to start from a blank page. On the Mira home screen you'll see ready made Mira Agents, like the Industry Roundup Agent (a summary of the latest news and trends) and the Coverage Agent (reach, sentiment, and key themes). Click one and let it do the heavy lifting.
Make it yours, then send it:
- After Mira generates the summary, you can edit it instantly right there to add a note or trim it down.
- Then share it as a live link, or export it as a PDF you can email straight to your boss.
One rule: Don't leave the insight sitting inside Mira Studio. Copy it, polish it, and send it. Distributing it is what makes your boss (and their boss) notice.
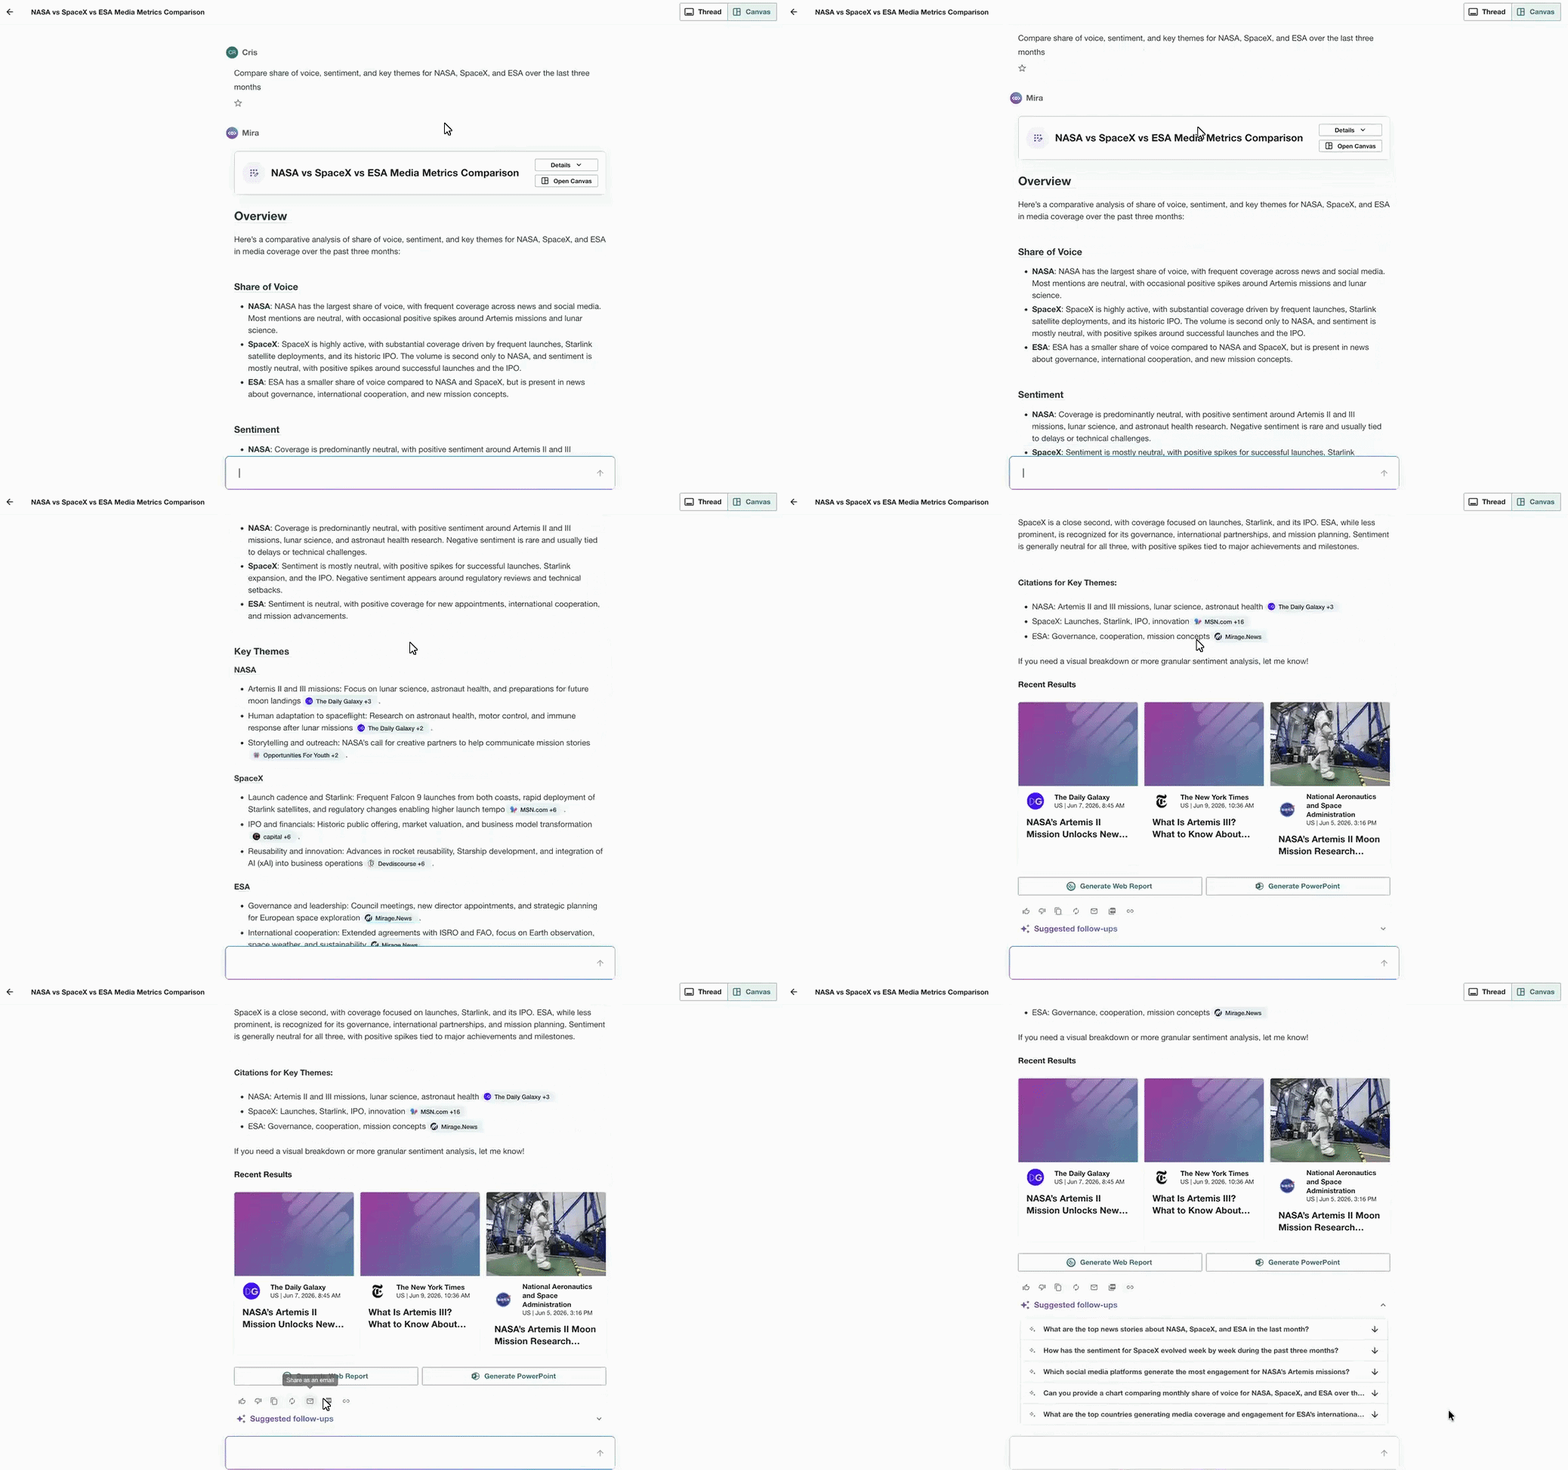
The payoff: A polished, ready to send summary for the leadership meeting, written in the time it takes to refill your coffee.
Keep going (Resources)
- Article, How to Add AI Insights to Your Dashboard (In Seconds): Read this when you want to master the first tip and turn every widget into a written takeaway.
- Article, How to Filter Your Meltwater Results (Like Ctrl + F): Read this for the full breakdown of quick scans, keyword filters, and saved filter sets.
- Article, How to Compare Share of Voice using Explore Searches: Read this when you're ready to build the benchmark dashboard and the Mira Studio summary.
- Workshop, 5 Ways to Woo Your Boss with Meltwater: Watch this to see the full flow demoed live from start to finish.
- Blog, How to Turn Brand Monitoring into Actionable Intelligence: Read this when you're ready to go beyond the quick wins and see how these steps add up to real, decision driving intelligence for your whole team.