

How to Compare Share of Voice using Explore Searches

The Winter Olympics just ended. The medals are counted. The highlights are everywhere.
Now your leadership team asks:
“Which sport got the most media coverage?”
“Was figure skating more positive than snowboarding?”
“Is curling getting attention, or is it niche?”
“How do I compare share of voice in Meltwater?”
These are benchmarking questions.
Whether you are comparing Olympic sports, brand campaigns, product launches, or competitors, the goal is the same. You want to understand who owns the conversation, where that attention is happening, and how people feel about it.
This is exactly what Share of Voice (SOV) is designed to answer.
Share of Voice = how much attention one topic gets compared to another.
That attention can be measured by:
- Mentions
- Reach
- Engagement
- AVE
- Sentiment
- Source type
In this guide, you will learn how to:
-
Build clean, comparable searches in Explore
-
Create a benchmark dashboard in Analyze
-
Use Mira Studio to generate fast, executive-ready insights
Step 1: Create One Search per Topic in Explore
- You’ll need to create a search in Explore for each “Olympic sport” . The easiest way to do this is to ask the AI Search Assistant to create one search per sport :
- Figure Skating Search
- Snowboarding Search
- Curling Search
- Select Save so you will be able to use the search in Analyze
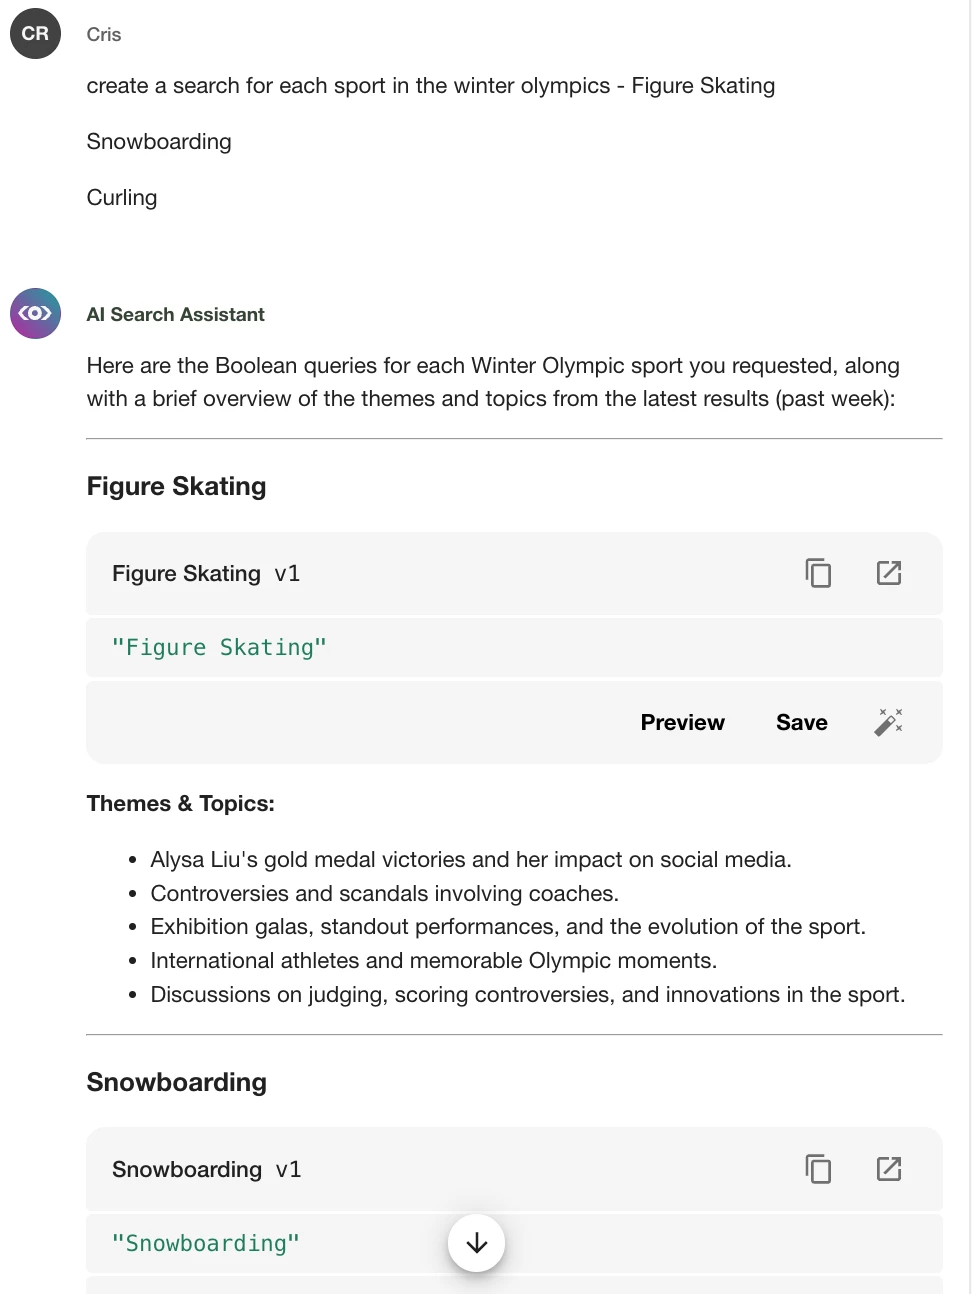
Example Searches:
- Figure Skating
- Snowboarding
- Curling
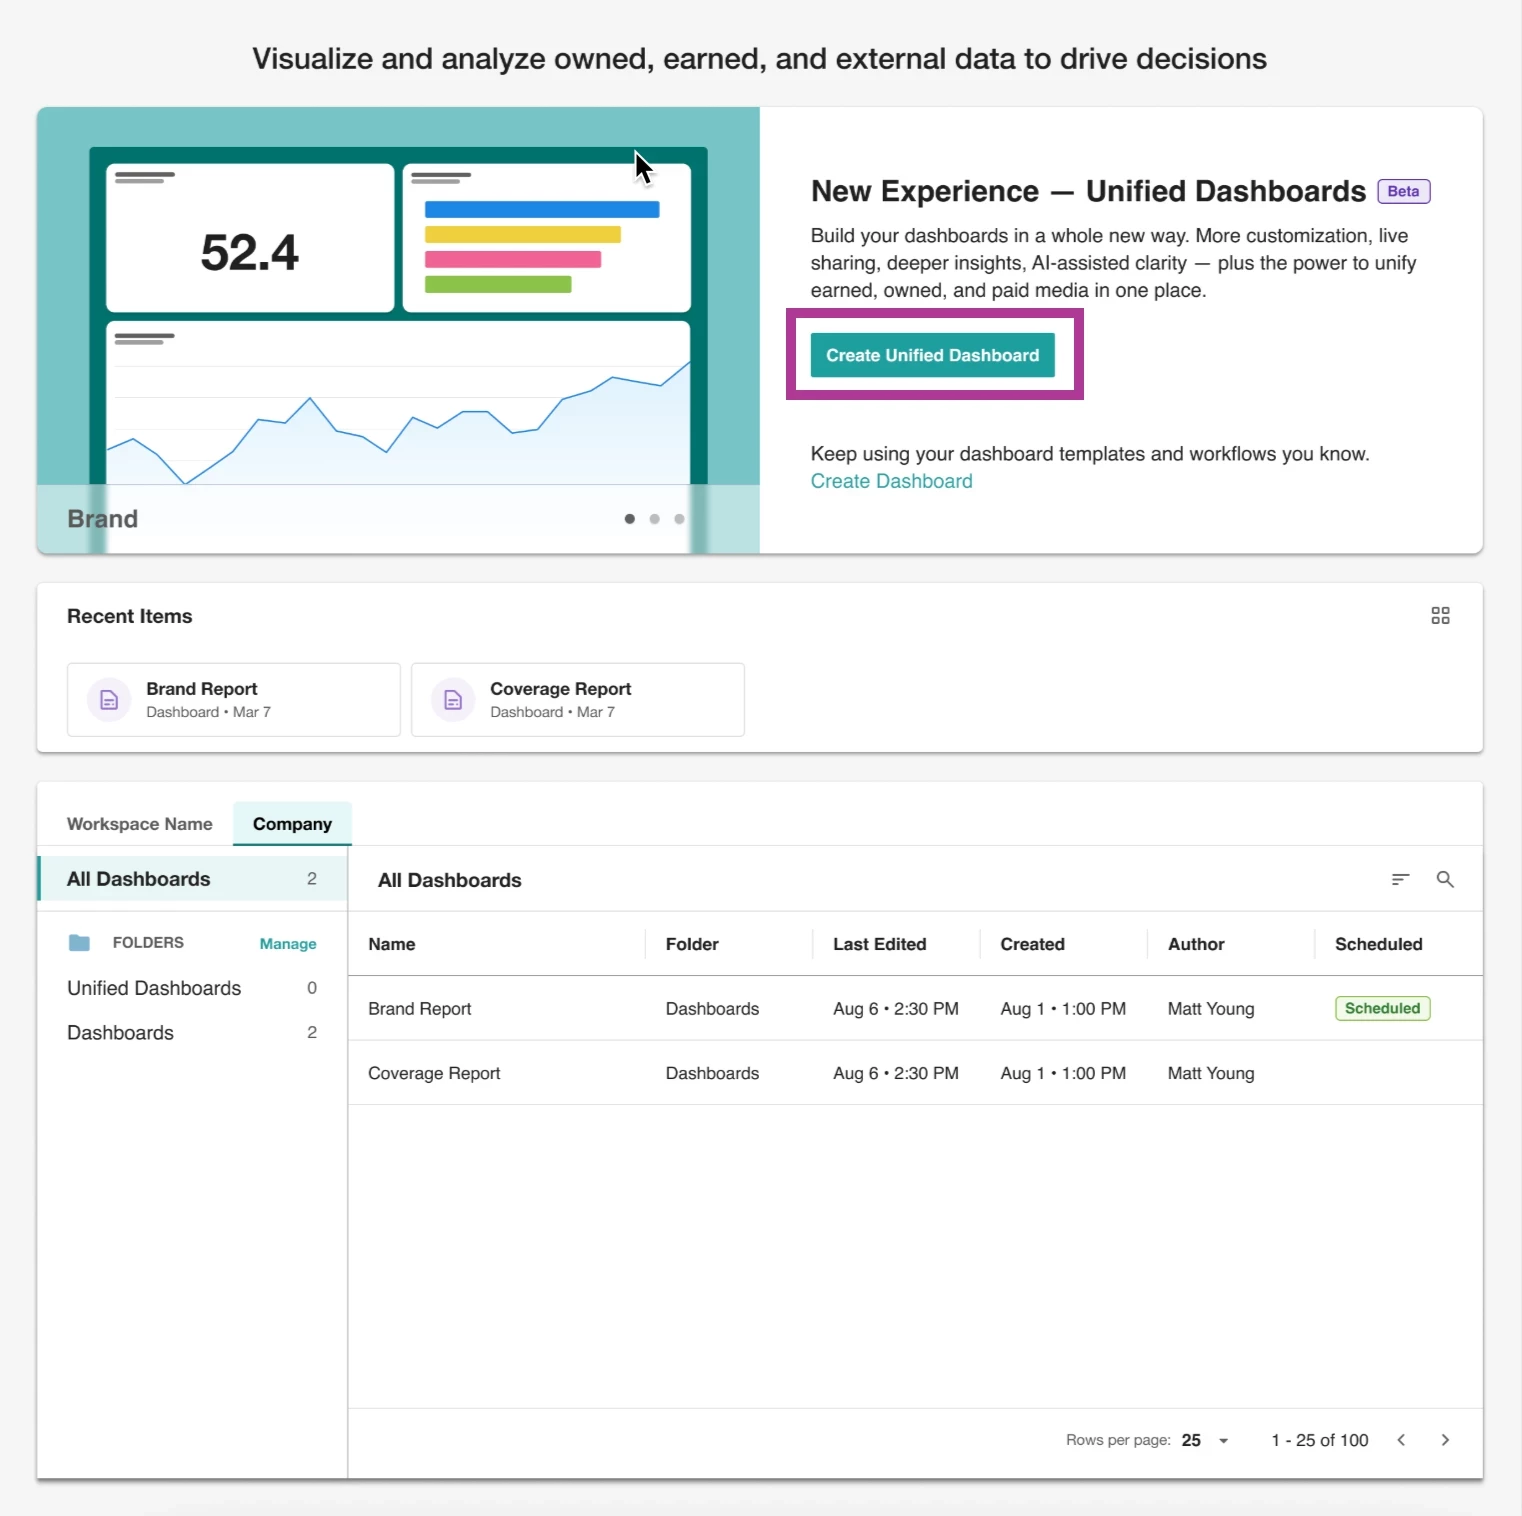
Step 2: Build a Share of Voice Dashboard in Analyze
- Go to Analyze → select Create Unified Dashboard or Get Started
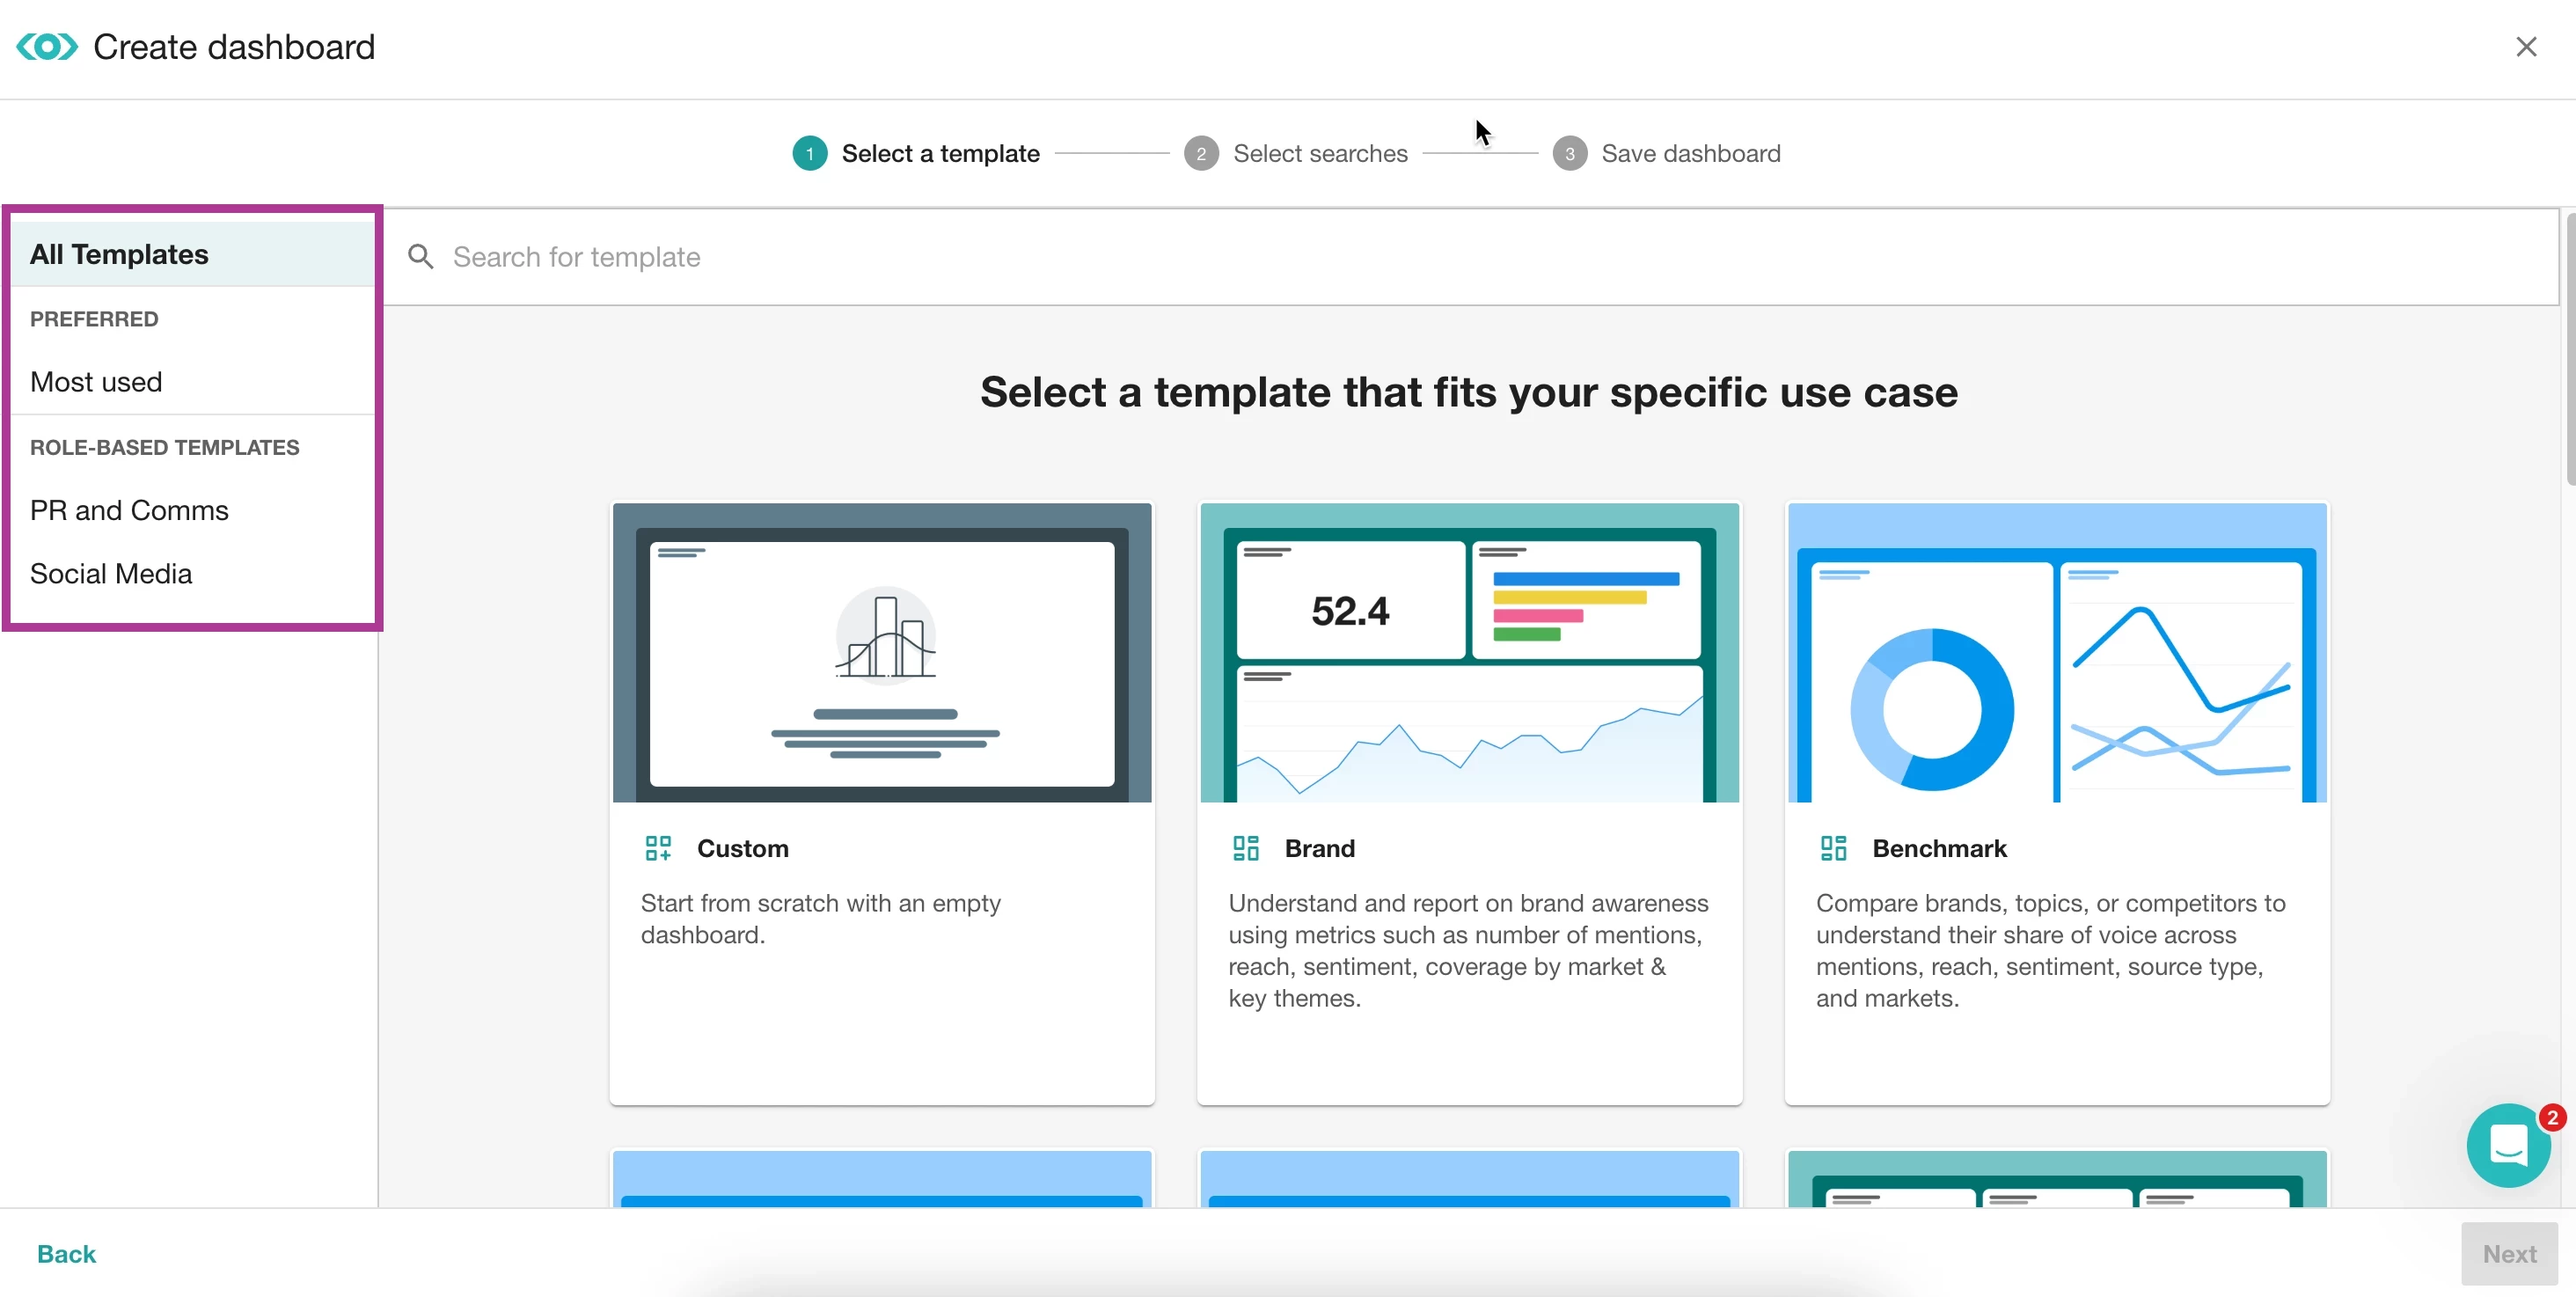
- Choose the Benchmark template.
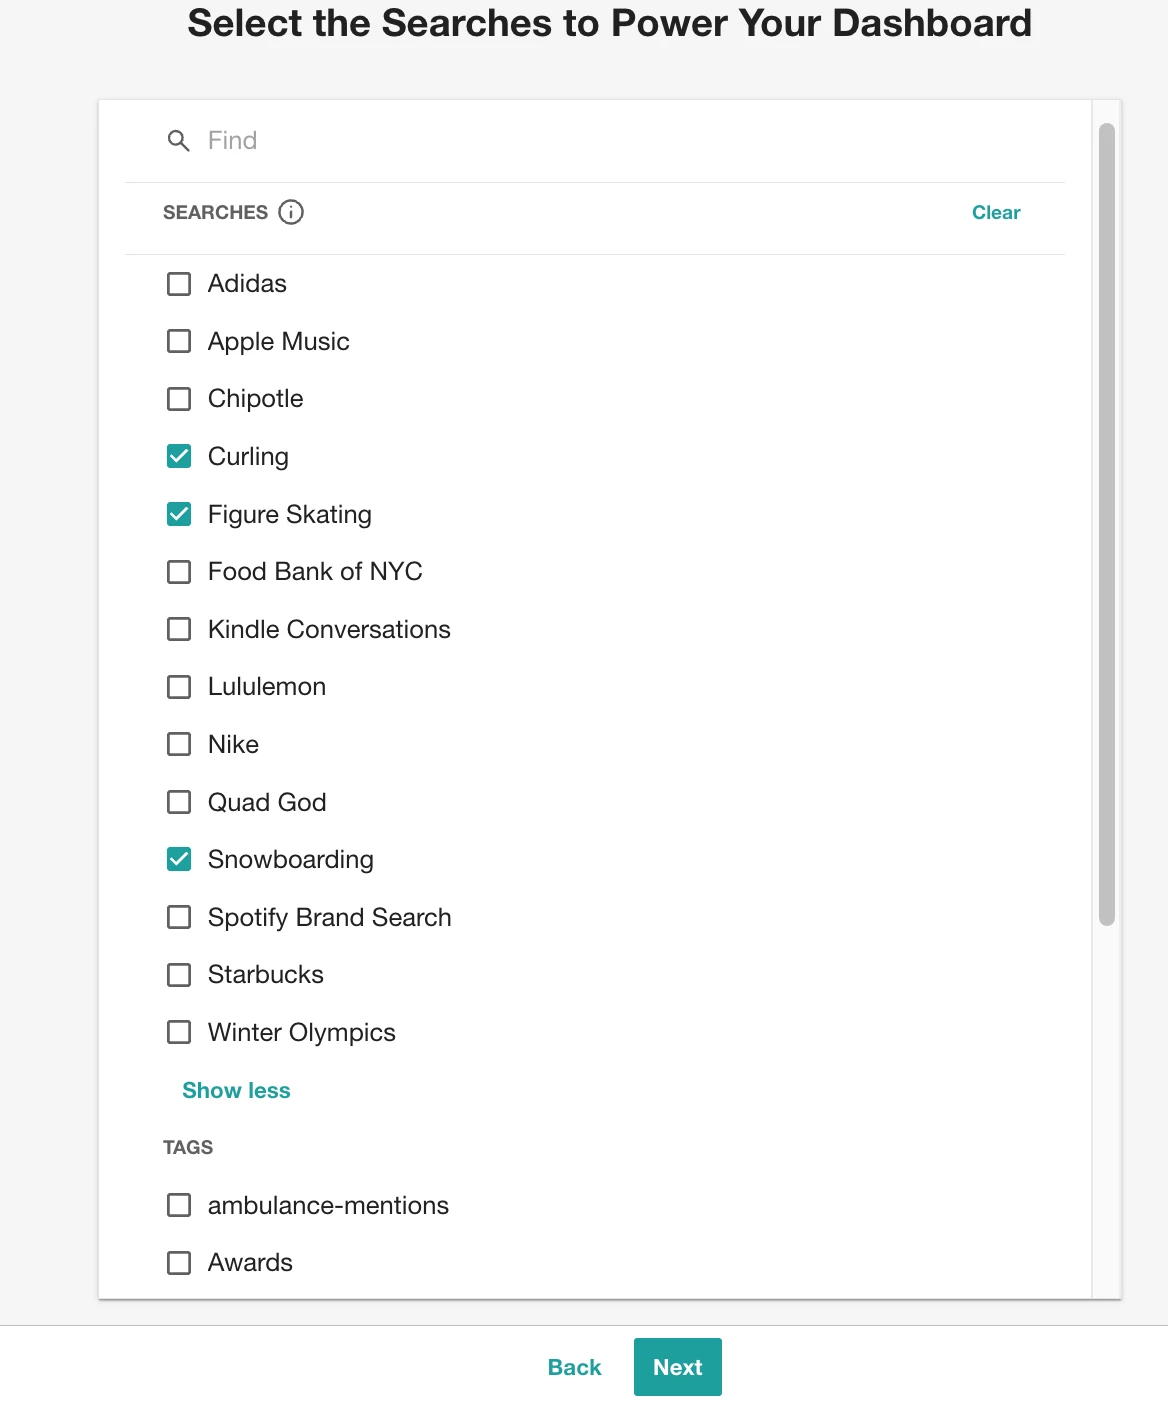
- Then, select your saved searches to compare
- Click Next
Now it’s time to turn that data into a dashboard report with some below widgets.
Step 3: Select the Analyze Widgets for SOV Comparison
When evaluating competitors (or in this case, sports), you can edit the dashboard and add these widgets:
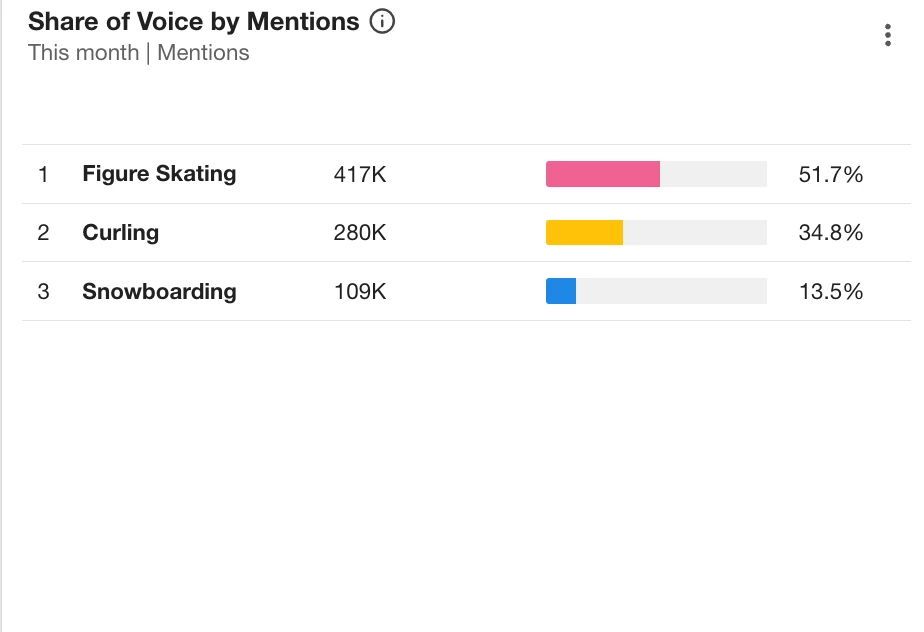
📊 Share of Voice by Mentions
-
Shows percentage split between sports
-
Great for: “Which sport dominated coverage?”
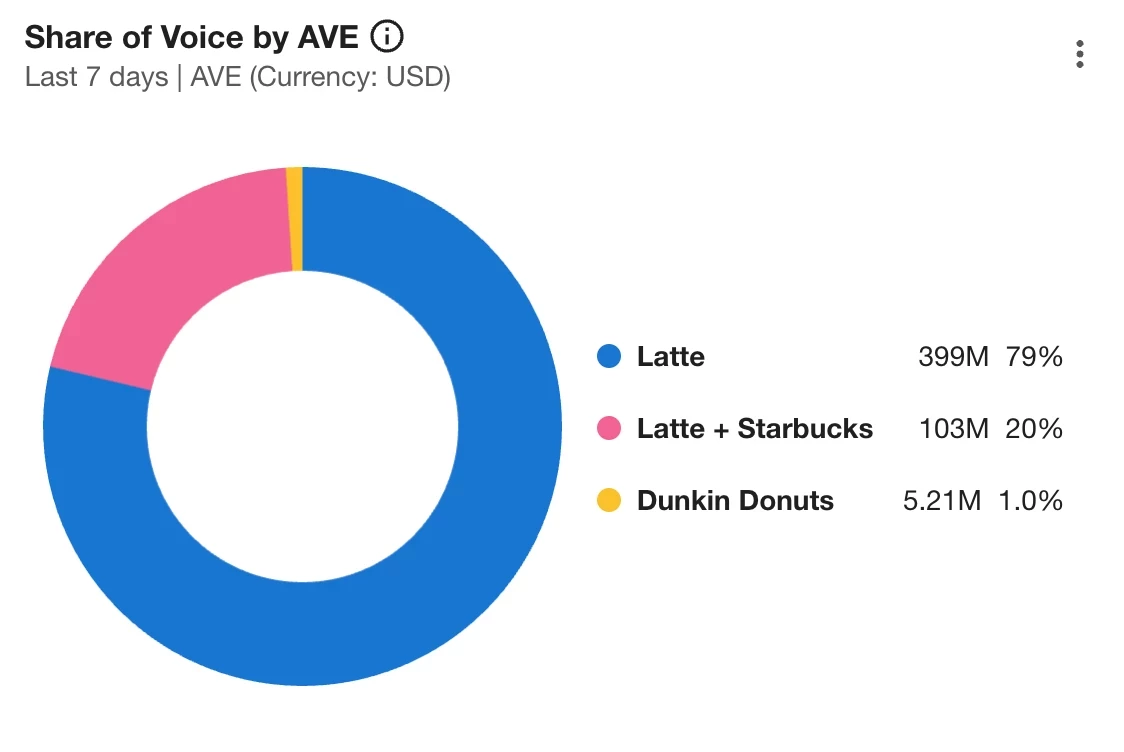
💰 Share of Voice by AVE
-
Compares advertising value equivalent
-
Great for: “Which sport generated the most media value?”
📣 Share of Voice by Engagement
-
Measures total interactions
-
Great for: “Which sport sparked the most conversation?”

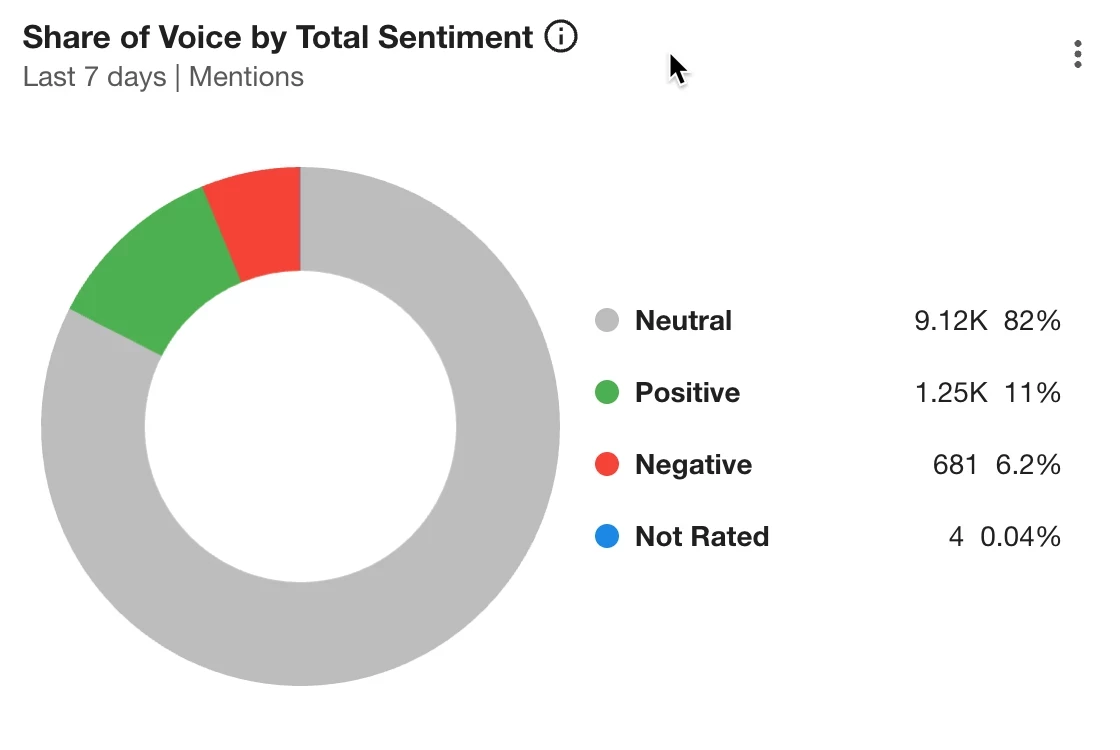
😊 Share of Voice by Sentiment
-
Compares positive / neutral / negative breakdown
-
Great for: “Which sport had the strongest public perception?”
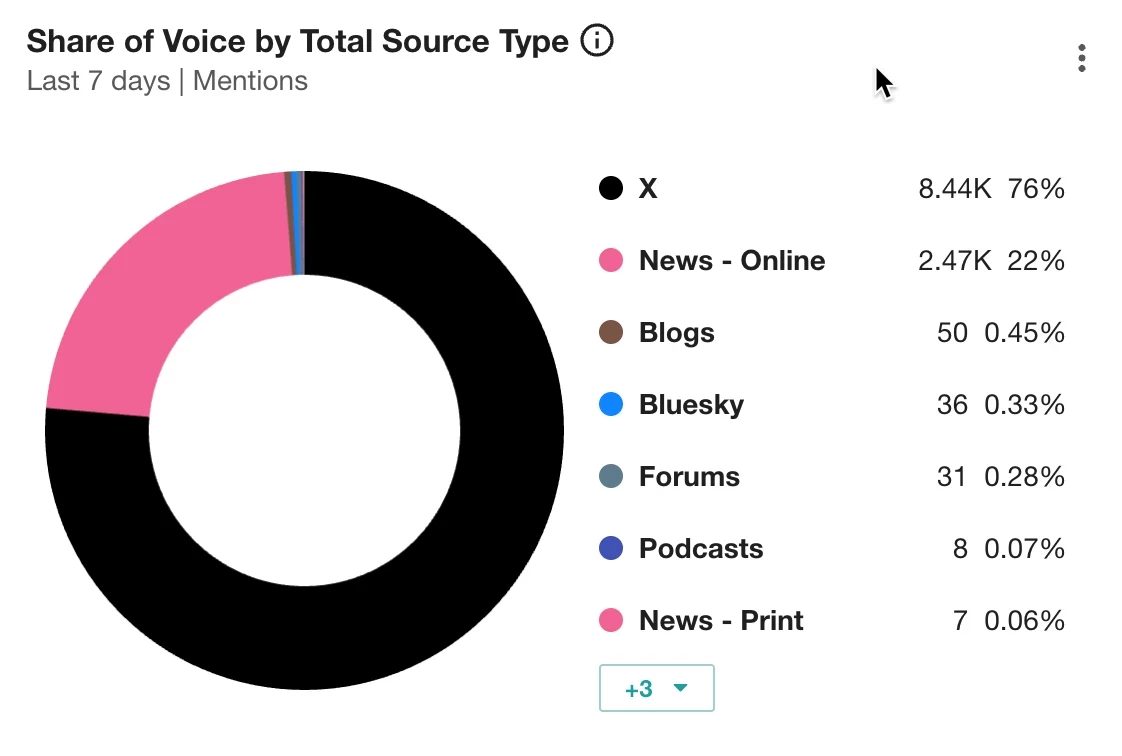
🌍 Share of Voice by Total Source Type
-
Shows channel breakdown (News, X, Blogs, Broadcast)
-
Great for: “Was snowboarding more social-heavy?”
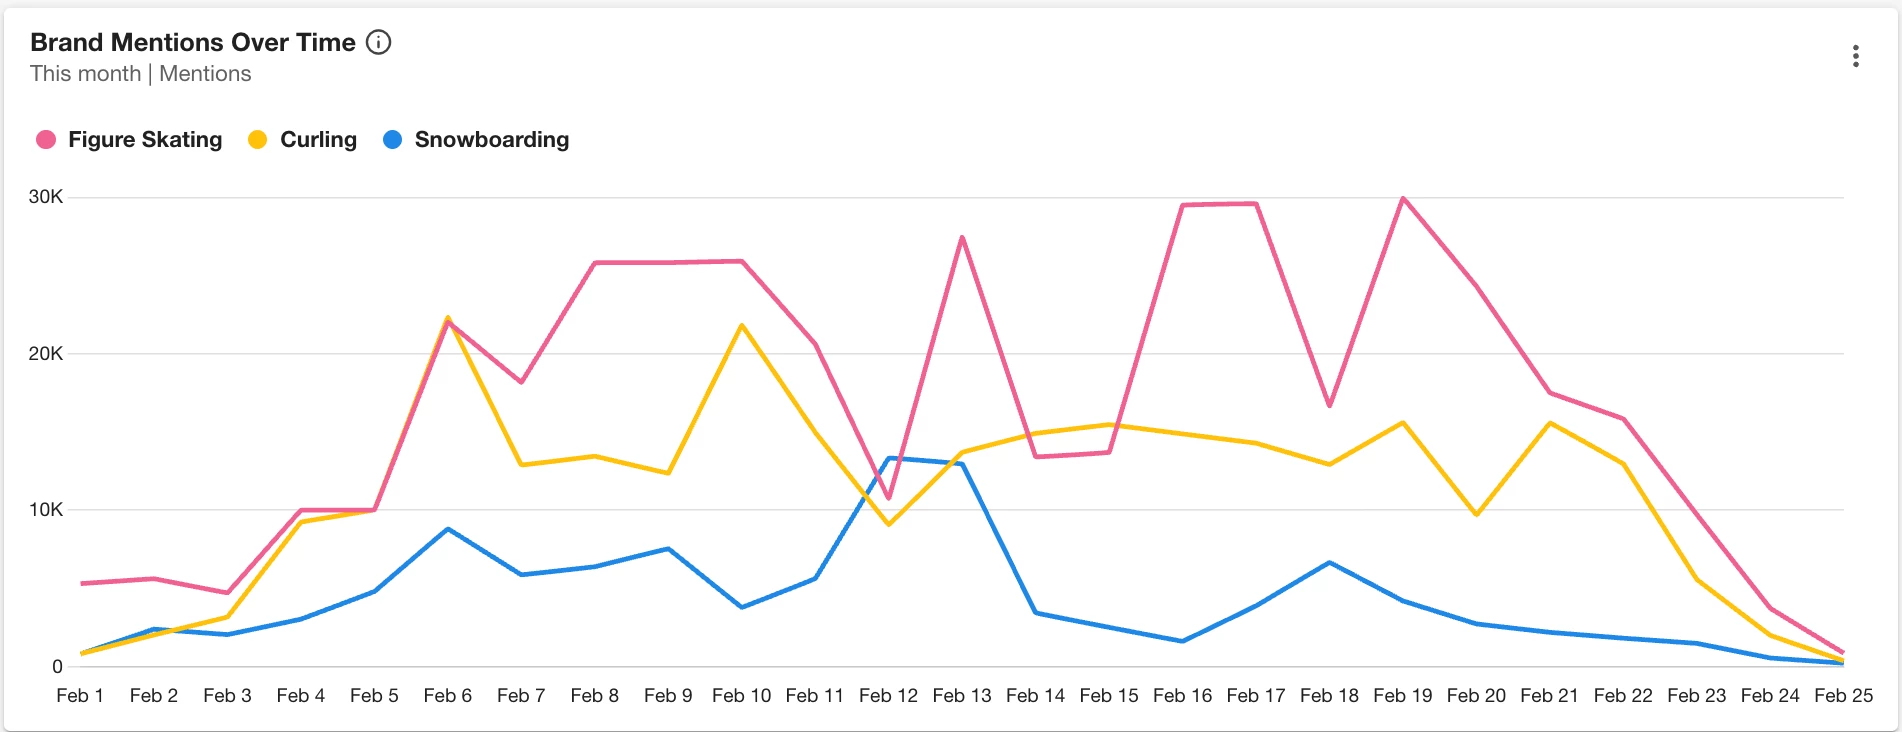
📈 Mentions Trend
-
Track spikes over time
-
Great for: medal wins or viral moments
Step 4: How to Translate SOV Metrics Into Insight
If Snowboarding has highest mentions:
“Snowboarding drove the largest share of overall media conversation.”
If Curling has lower mentions but higher engagement:
“Curling generated fewer articles, but the audience interaction rate was disproportionately high.”
If Figure Skating has higher negative sentiment:
“Figure skating had strong visibility, but judging controversies drove a higher share of negative sentiment.”
Always translate numbers into narrative.
Step 5: Compare Share of Voice Using Mira Studio
If you need fast answers or executive-ready summaries, use Mira Studio.
Example Prompt:
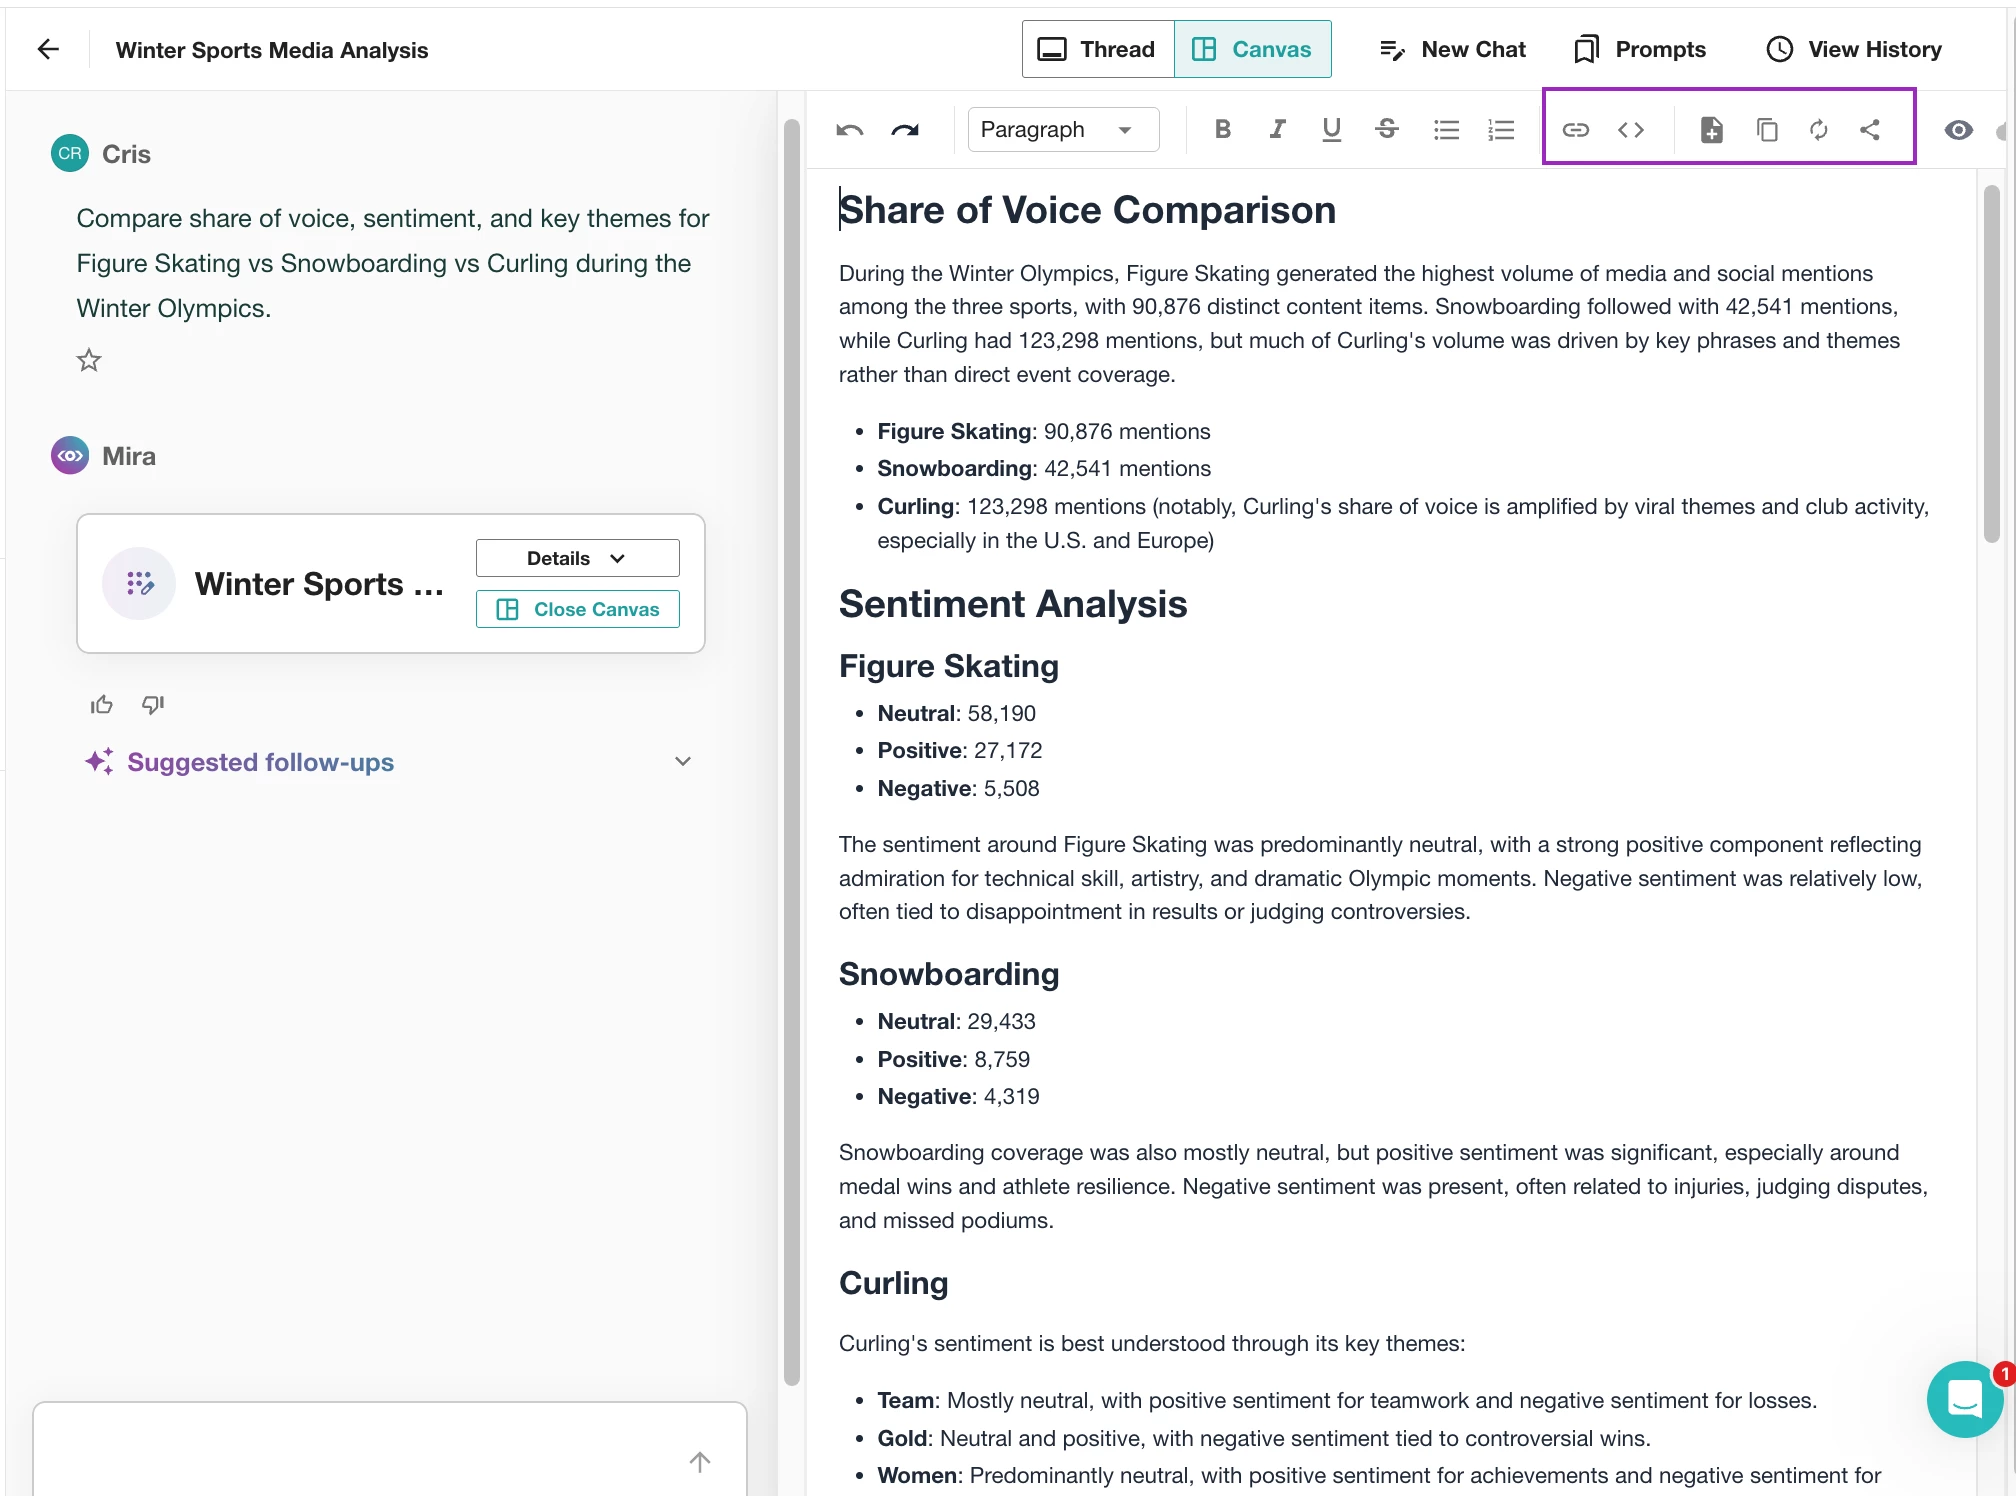
Compare share of voice, sentiment, and key themes for Figure Skating vs Snowboarding vs Curling during the Winter Olympics.
Mira Studio will generate:
- Mention comparison
- Sentiment analysis
- Key themes
- Comparative insights
This adds context on top of raw metrics.
How to Use Mira Insights
Once Mira generates insights:
- Add key takeaways to your stakeholder email
- Share highlights with your social or comms team
- Include summaries in campaign recap decks
- Use insights in executive briefings
- Apply findings in press strategy planning
Do not leave insights inside Mira. Distribute them.
That’s benchmarking with context. Now don’t let that insight sit in Mira Studio; Copy the key takeaways and:
-
📩 Drop it into your weekly stakeholder email
-
💬 Share it in Slack with your comms or social team
-
📊 Paste it into your campaign recap deck
-
📝 Add it to your executive summary slide
-
📣 Use it in a press strategy or planning meeting
When to use Analyze vs. Mira Studio
| Use Mira When… | Use Analyze When… |
|---|---|
| You need quick answers | You need repeatable reporting |
| You want AI-generated insights | You need custom widgets |
| You’re prepping for a meeting | You’re building monthly reports |
| You need theme summaries | You need KPI benchmarking |
Final Takeaway
Whether you're comparing Olympic sports, brands, campaigns, or competitors — the workflow is the same:
-
Create one search/tag per entity in Explore
-
Build a dashboard with SOV widgets in Analyze
-
Add AI narratives for context in Mira Studio
If you’re benchmarking in Meltwater, what are you currently trying to compare?