Stop Screenshotting: Export Your Coverage as a Clean Spreadsheet

You ran a search. You found the coverage. Now your manager wants a spreadsheet.
Or maybe you're building a monthly report, pulling clips for a client recap, or just need a record of what ran during a campaign.
This is where exporting comes in.
By the end of this guide, you'll know how to select results from your content stream, download them as an Excel or CSV file, and know where to check if something goes wrong.
Before you begin
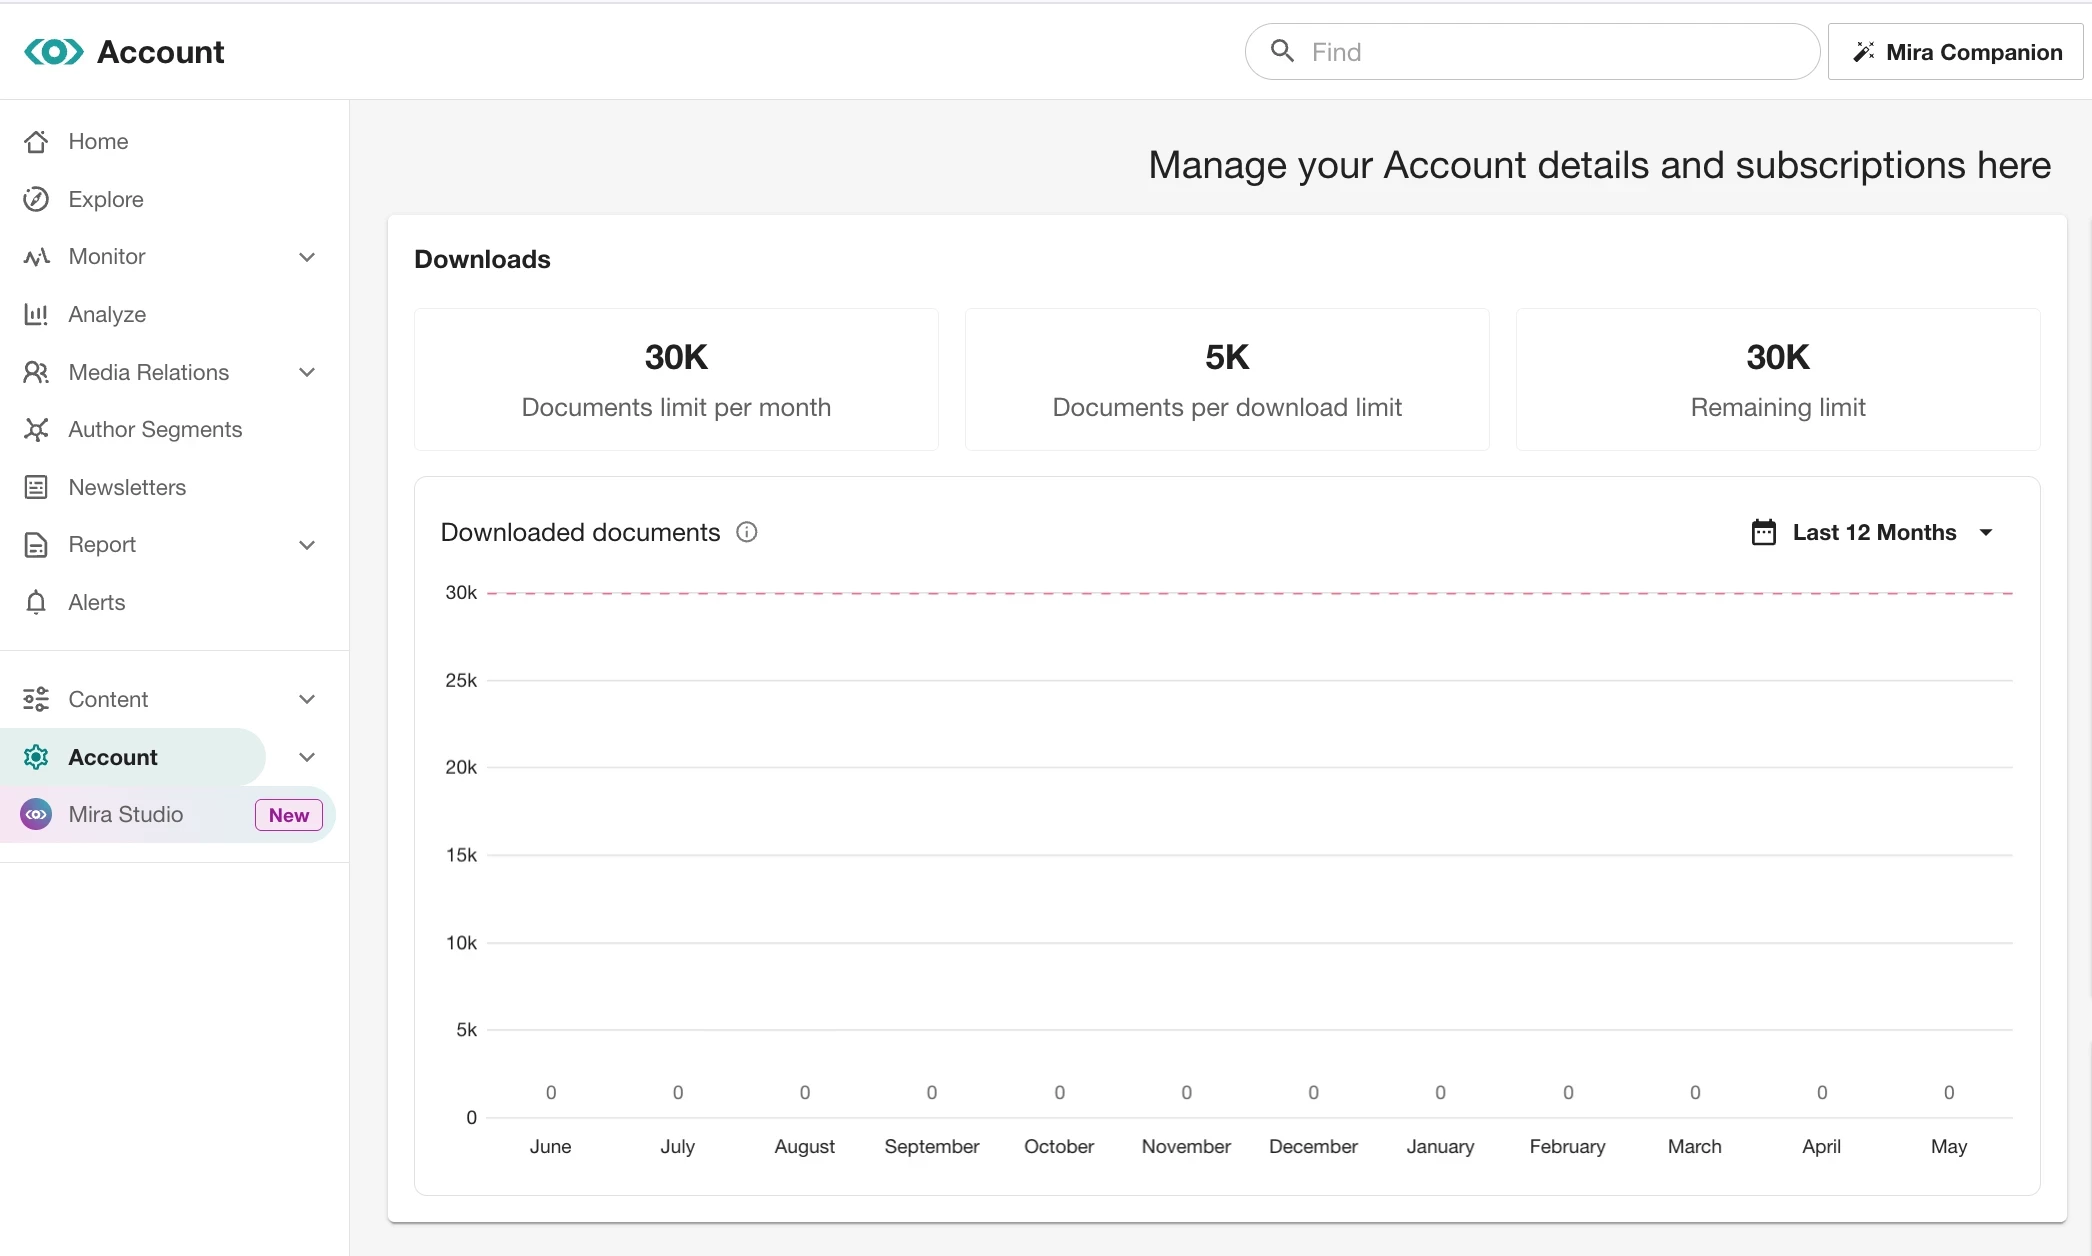
Exports in Meltwater have a monthly limit of 30,000 documents per account, shared across all users. This resets at the start of each month.
To check how many you've used: go to Account in the left-hand navigation (not the dropdown) → Downloads. You'll see your monthly limit, your per-download limit, and how many documents remain. If you need higher limits, reach out to your account manager to discuss options.
📥 Step 1: Get into your content stream
What you're doing: Finding the results you want to export.
Go to Explore and create or open a saved search.
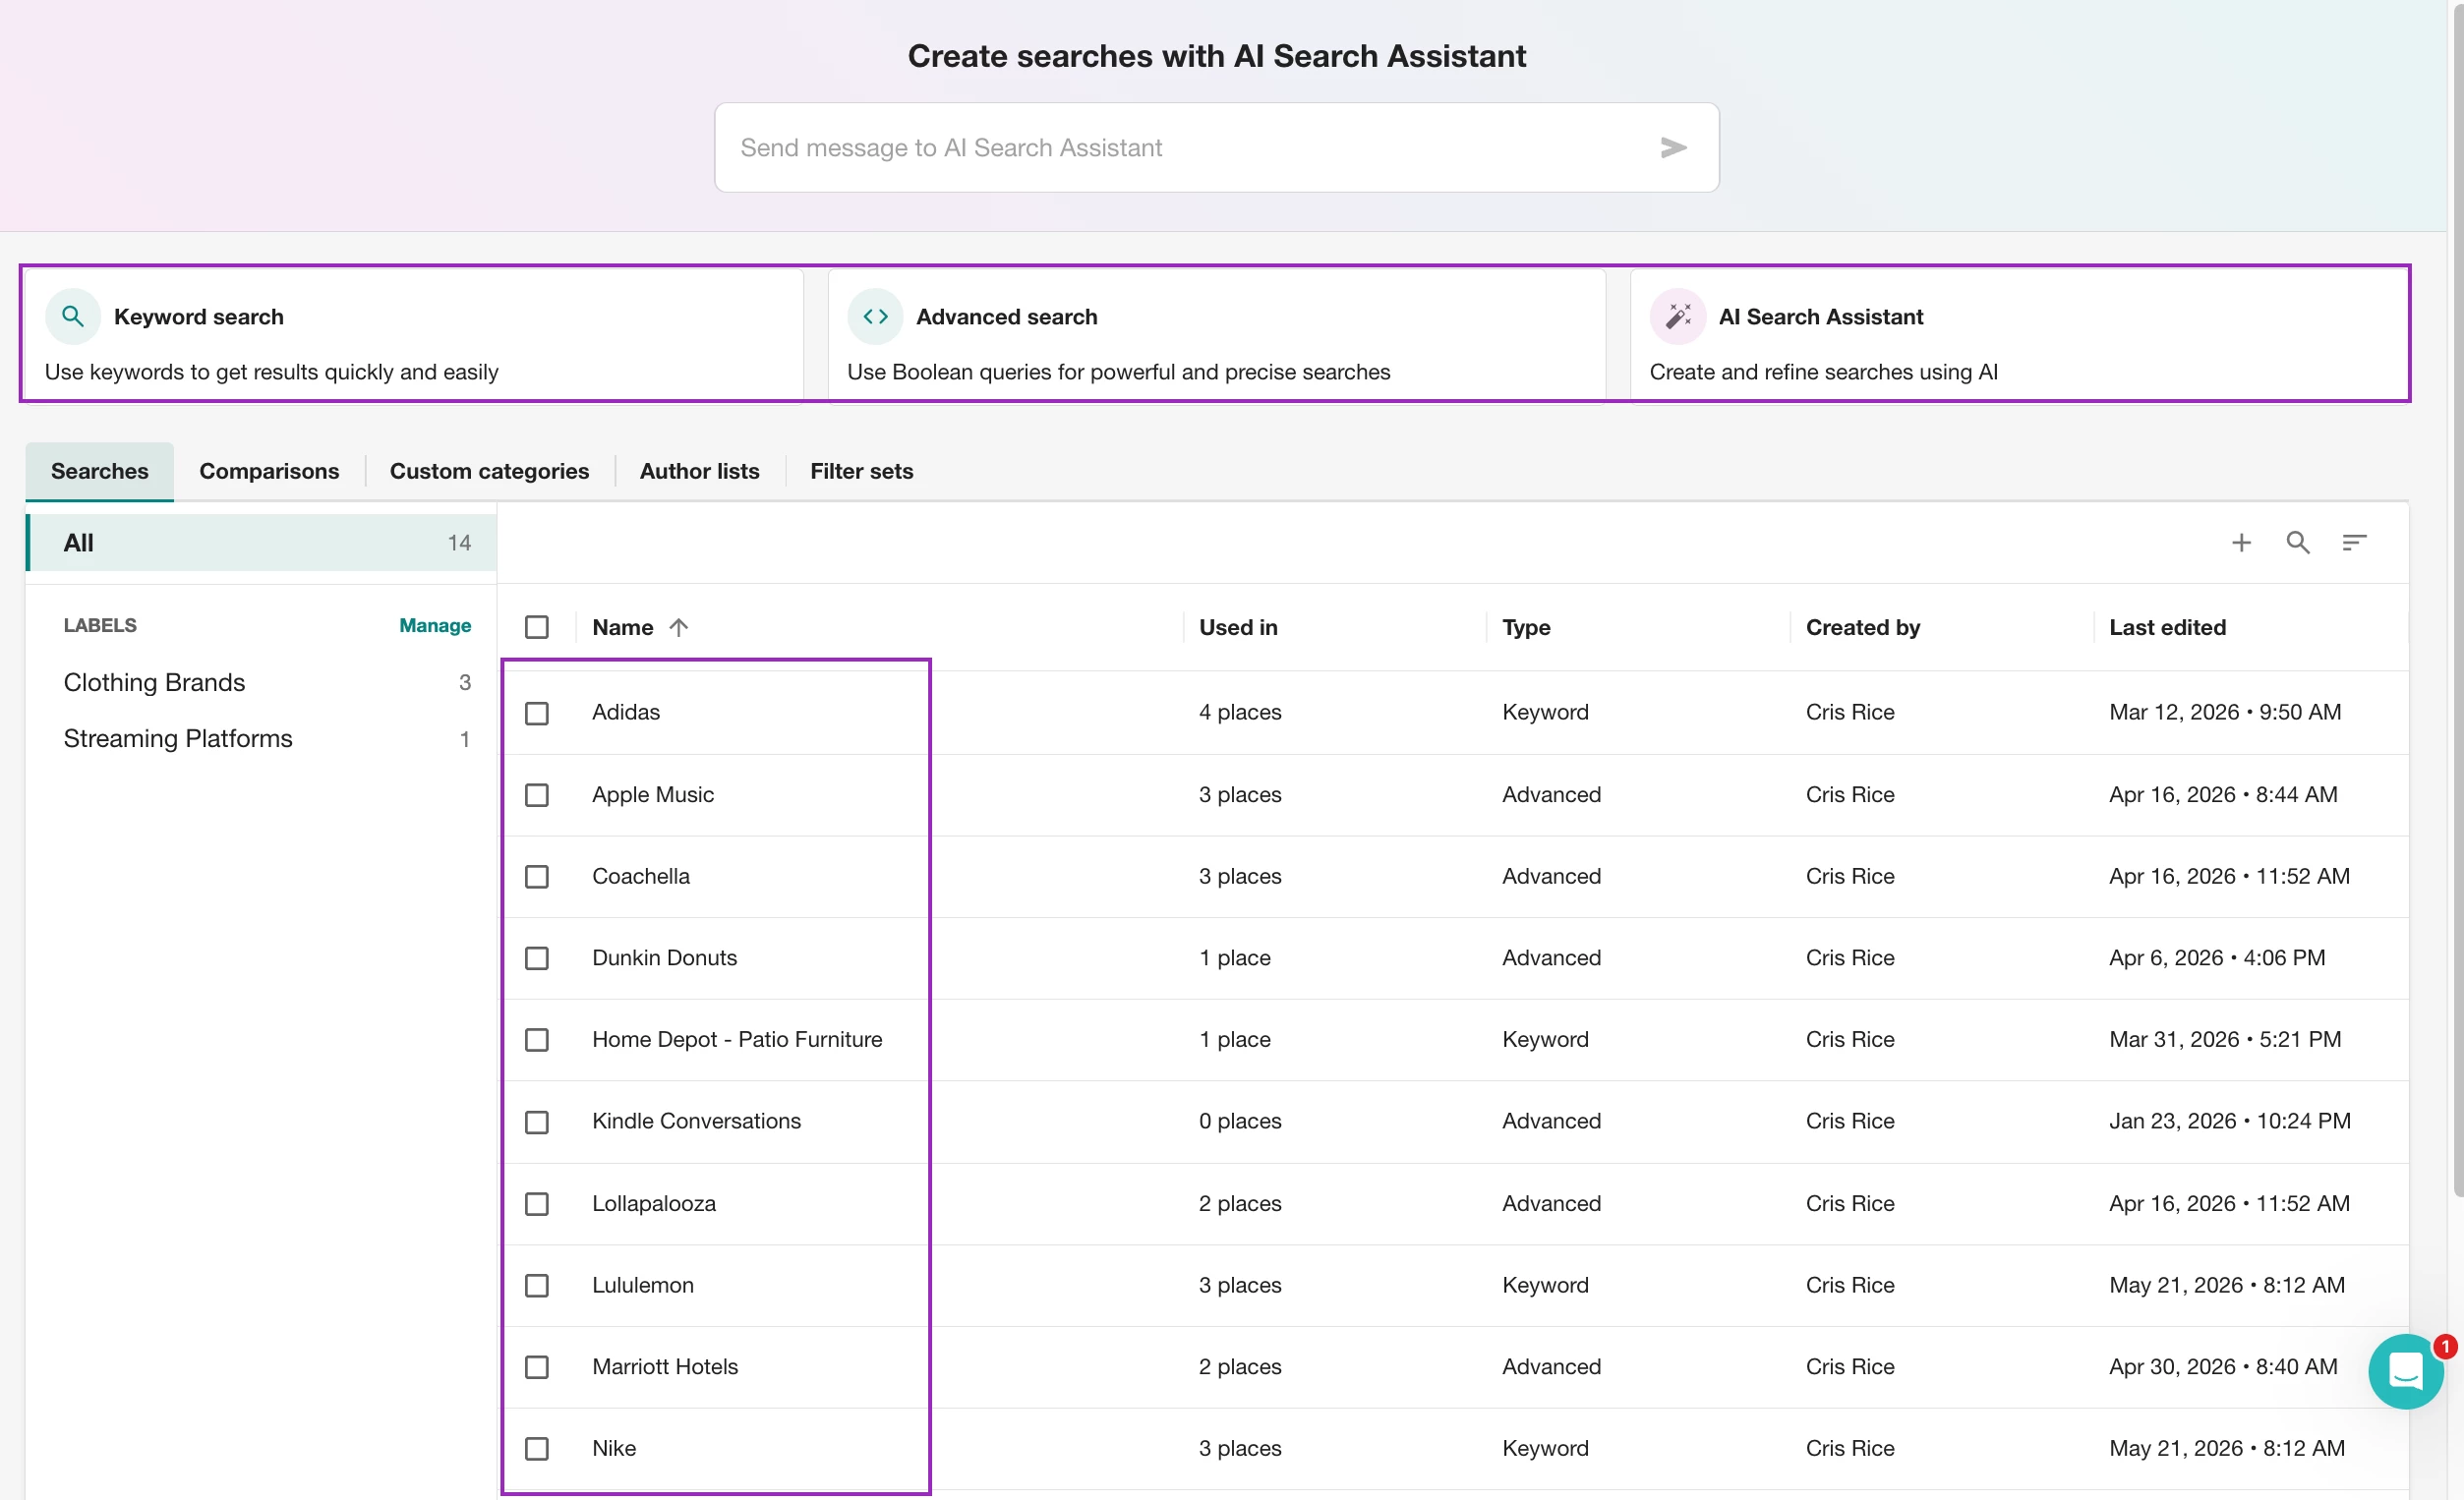
The content stream is the list of articles and posts on the left side of the screen — headlines, source names, dates.
This is what you'll be exporting from.
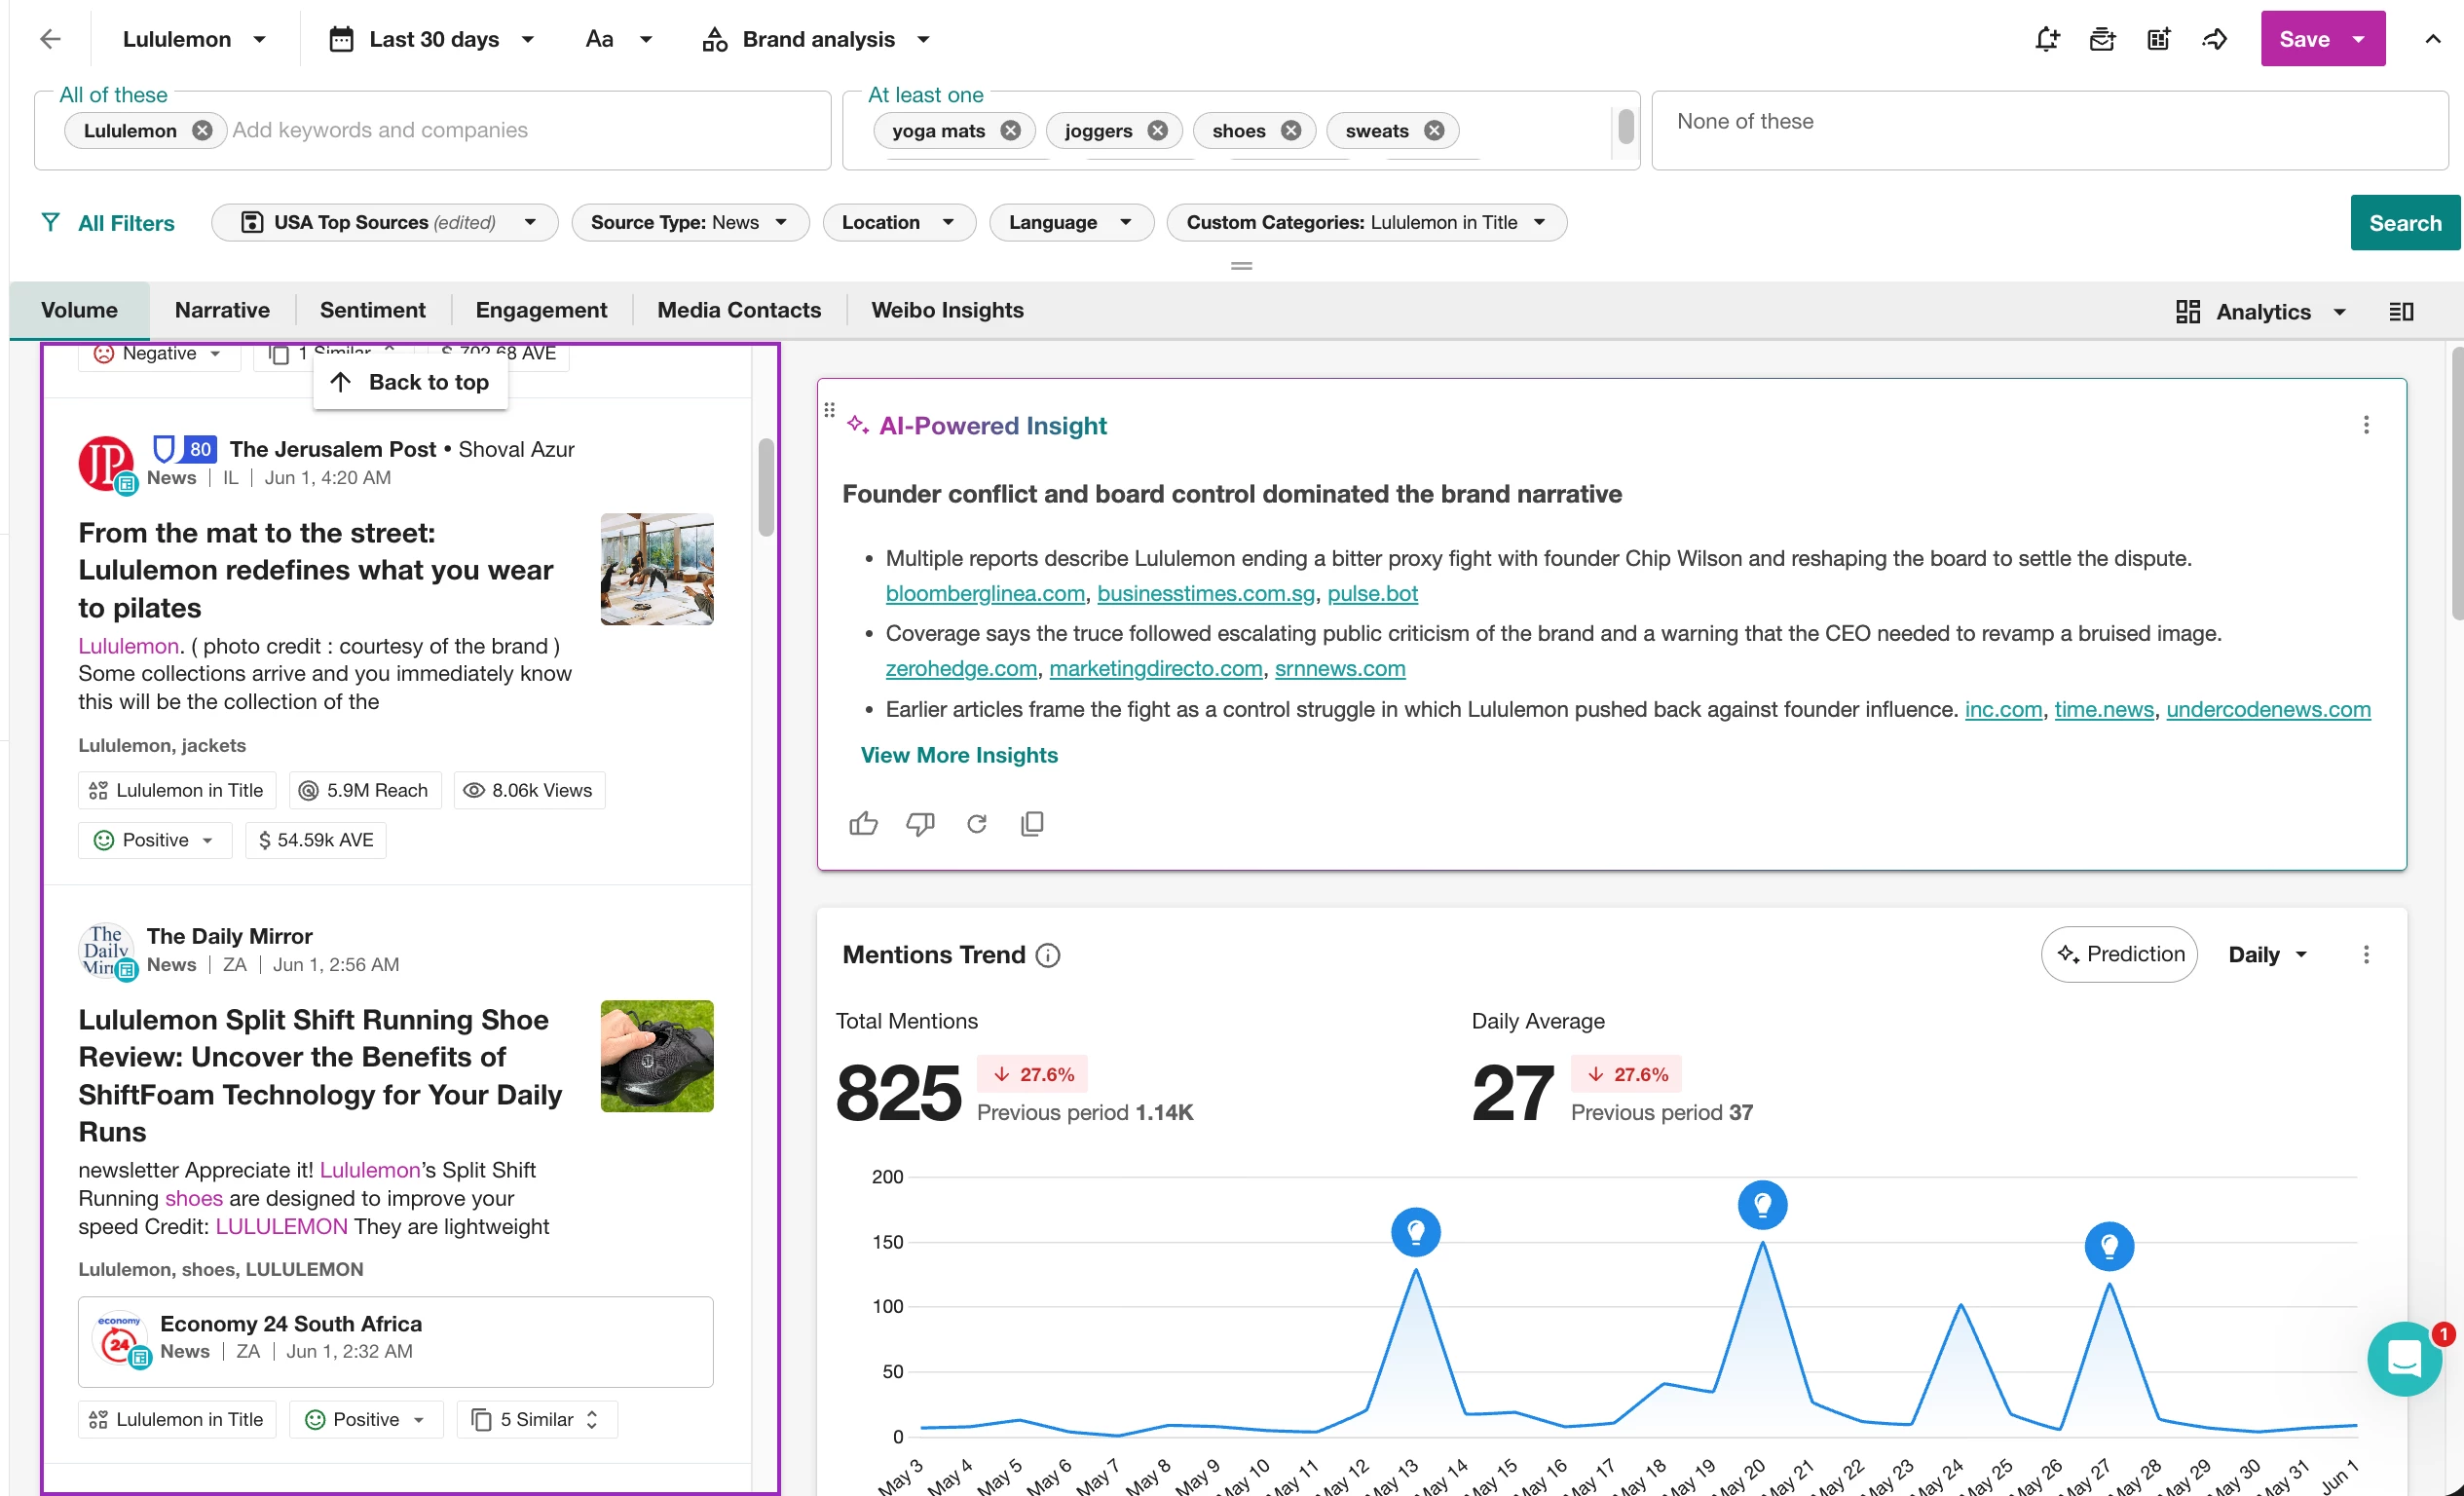
Example: You've been tracking Lululemon mentions over the past 30 days. You want to pull everything into a spreadsheet to share with your PR team before the quarterly review.
Set your date range and filters first. Exporting pulls exactly what you see — so filter before this next step. Learn how to filter your results in this article.
✅ Step 2: Select what you want to download
What you're doing: Choosing which results to include.
You have two ways to select results:
- Check the box at the top of the stream to select everything at once
- Or use the checkboxes to the left of individual results to hand-pick specific articles
Either way, as soon as you make a selection, a pop-up will appear asking:
"Include duplicates?"
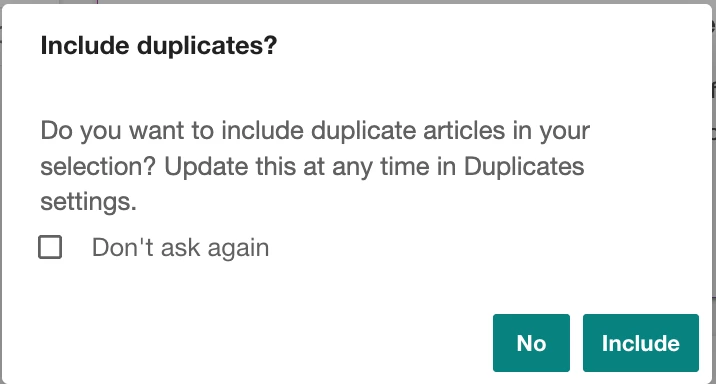
This is asking whether to include syndicated versions of the same story. When one article gets republished across multiple news sites, Meltwater detects those as duplicates and groups them
For example, one Lululemon story might get republished across 12 different news websites — Meltwater detects those as duplicates and groups them together.
- Click Include if you want every pickup, hit, and syndication in your export. This is the right choice for most reporting — especially if you're tracking reach or coverage volume.
- Click No if you only want one version of each story. This keeps your spreadsheet cleaner but will undercount how widely a story actually ran.
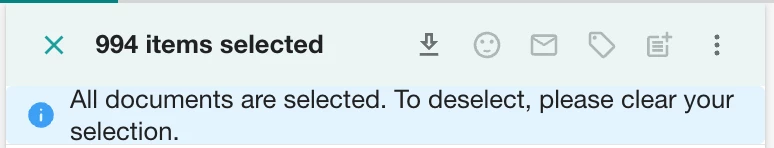
You'll then see a count showing how many documents are selected.
📄 Step 3: Click the download icon and choose your format
What you're doing: Setting up your export.
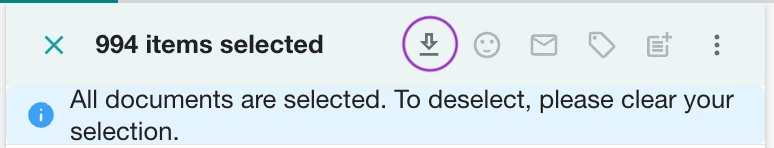
Once you've made your selection, click the download icon (it looks like a tray with a down arrow) in the toolbar above the content stream.
A Download document dialog box will appear with the below-
Format:
- CSV — opens in Excel or Google Sheets; best for filtering and analysis
- Excel — pre-formatted spreadsheet
- PDF — best for sharing as a document
Template:
- Popular fields and metrics — the recommended option. Includes date, source, headline, reach, AVE, sentiment, engagement, and more.
- Legacy — an older format; use this only if your team has existing reports built around it.
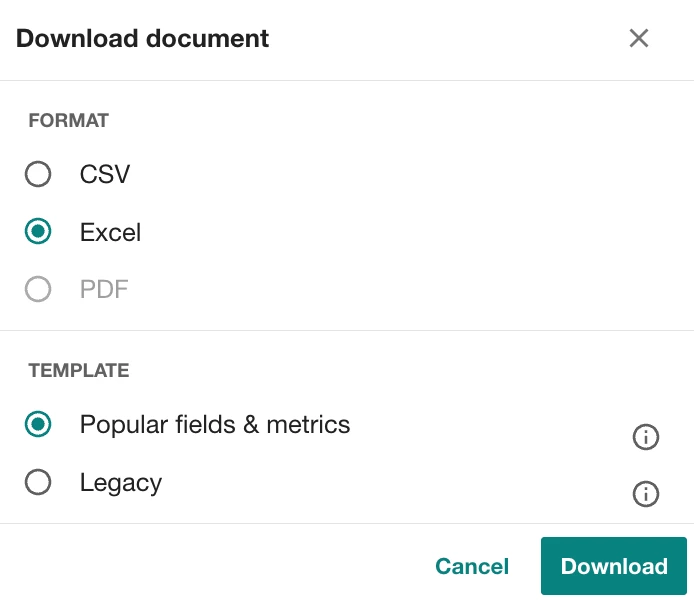
For most users starting out: choose Excel and Popular fields and metrics.
Then, click Download.
The hard part is done. Now you just need to find the file — it won't appear on your screen right away.
📬 Step 4: Find your file
What you're doing: Retrieving the export.
Meltwater will process the download and deliver it two ways:
- Email — a download link sent to the address you use to log in
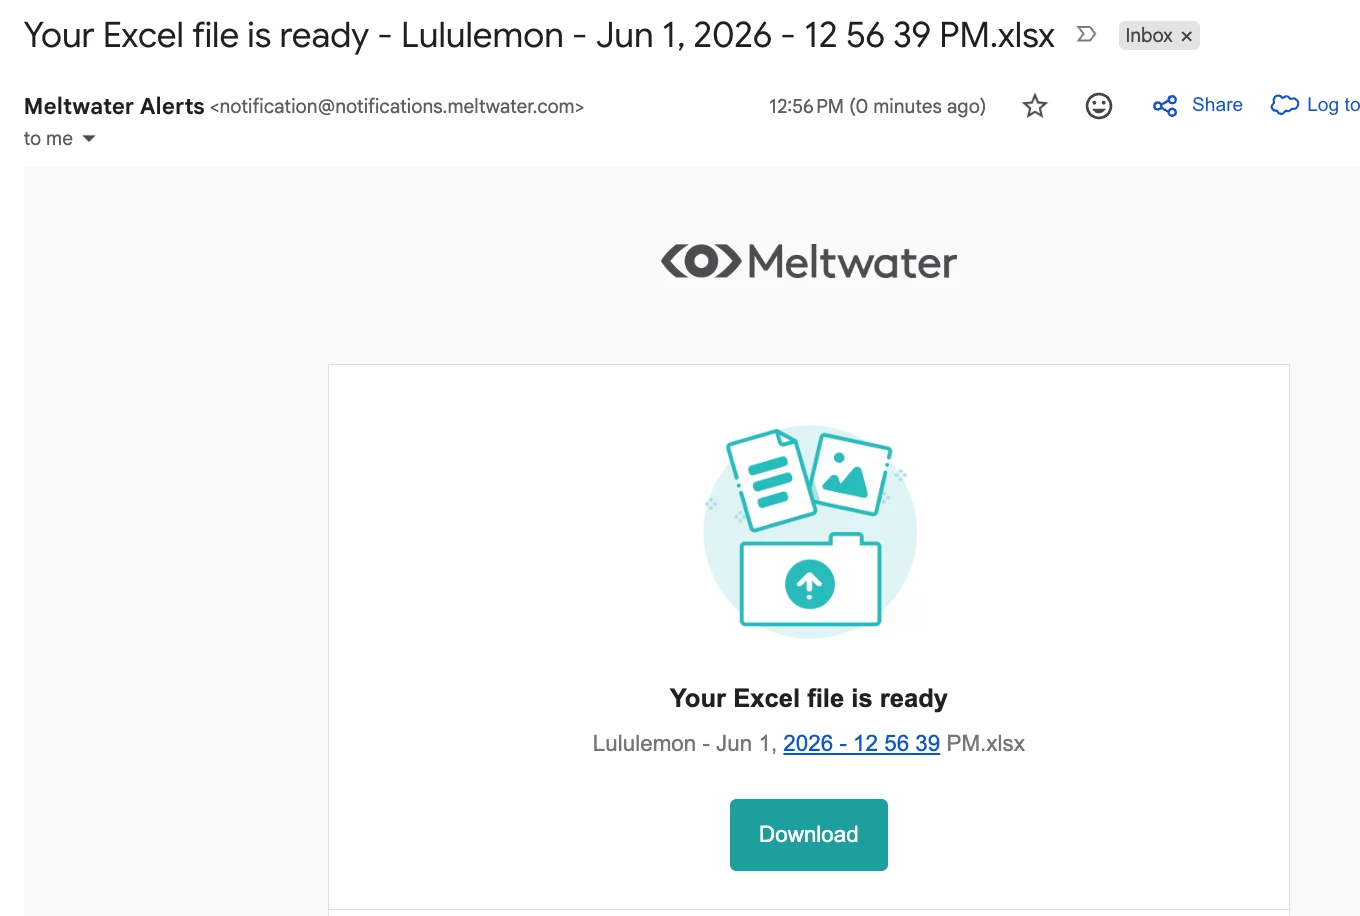
- Alert icon — a notification bell in the top right corner of the platform; click it, then click Download

The file usually arrives within a few minutes.
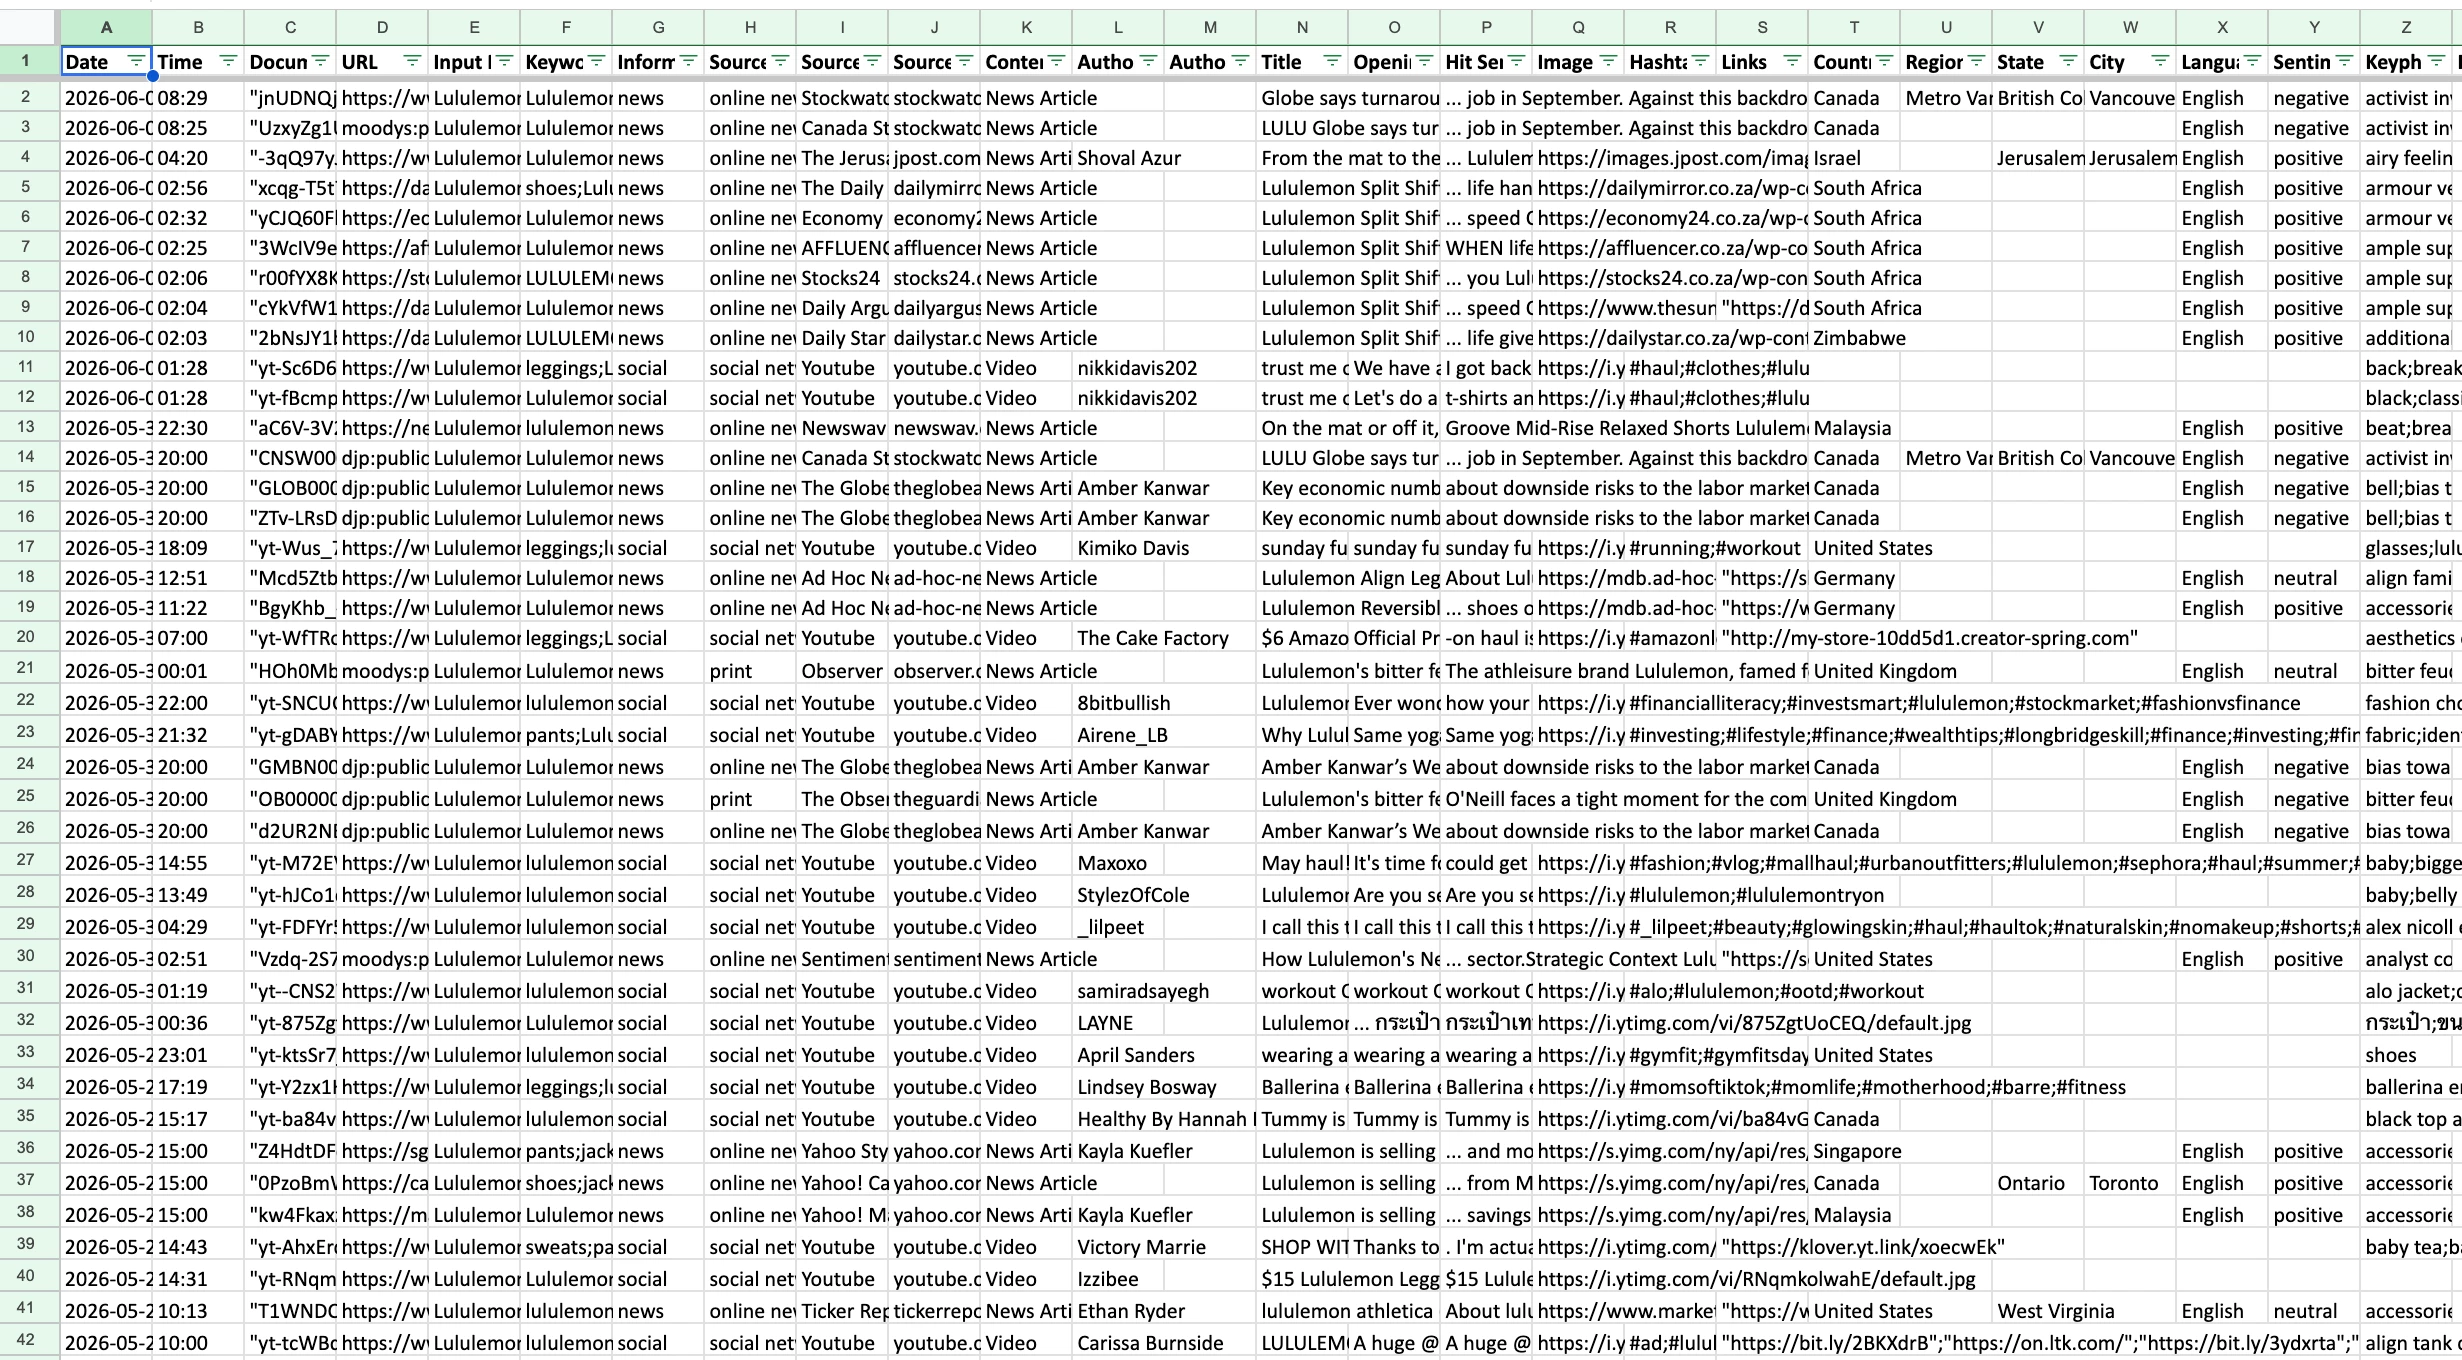
📊 What's in the file
When you open the spreadsheet, each row is one article or post. The columns include:
- Date and Time the content was published
- Headline and URL
- Source name and Source type (News, Social, Broadcast, etc.)
- Reach — the estimated audience size for that source
- AVE — advertising value equivalent; an estimate of what equivalent ad space would cost
- Sentiment — positive, negative, or neutral, based on language analysis
- Engagement — total interactions on the post or article
- Keywords that triggered the match
This is your media archive. Sort it, filter it, paste it into a report, or share it with a teammate.
🎯 What you can do with it now
Instead of screenshotting individual articles or manually copying headlines…You now have a clean, sortable record of your coverage. Use it to:
- Build a media clip report for leadership or a client
- Track coverage volume over a campaign window
- Pull AVE and reach numbers without doing any manual math
- Document results before a monthly reset
Something not working?
The email didn't arrive. Check your spam folder first. If it's not there, go to the notification bell in the top right corner — the download link is also available there.
The download link expired. Links are time-limited. If yours has expired, run the export again — it only takes a moment.
You've hit your limit. If your account has reached the 30,000 document cap, exports will be blocked until the monthly reset. Check your usage under Account → Downloads.