


Your brand just triggered a spike alert… now what?
Let’s say you’re monitoring Gatorade, and boom — you get a Spike Detection alert: mention volume just surged.
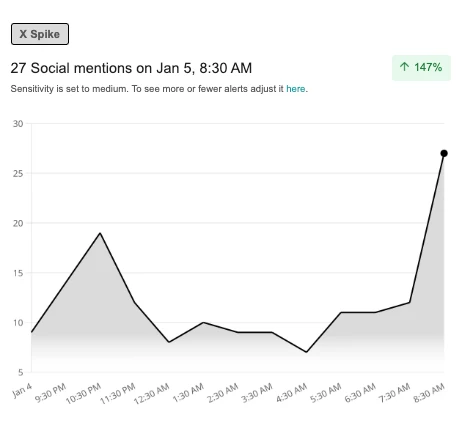
Here’s how to use Meltwater to understand why it spiked and what to do next.
🔎 Step 1: Jump Into Explore From the Alert
Click “Discover more insights” at the bottom of the alert email — it’ll open the exact saved search and date range in Explore.

Once you’re there, scan the stream:
-
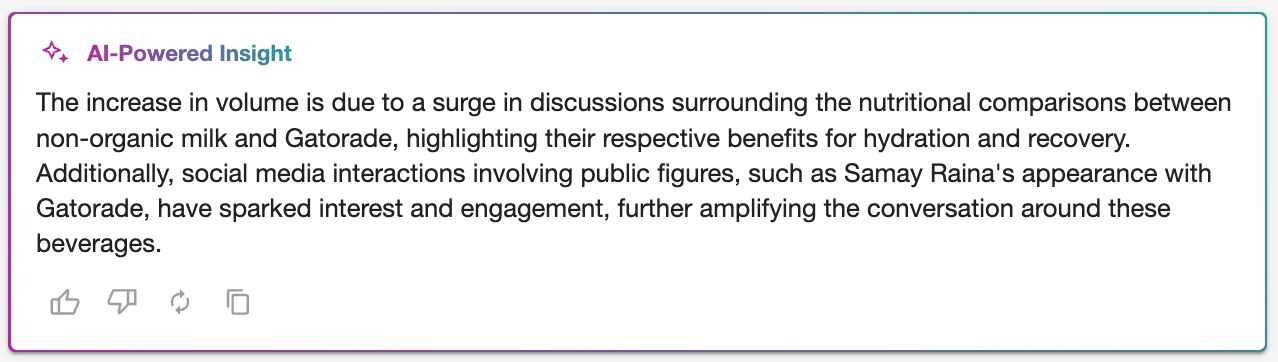
At the Top: Check the AI Insight
-
The AI-Powered Insight gives you a smart summary of what’s new or different. It highlights emerging topics, shifts in conversation, and common themes behind the spike, a great starting point.
-
-
On the Left: Scroll Down the Mentions Feed
-
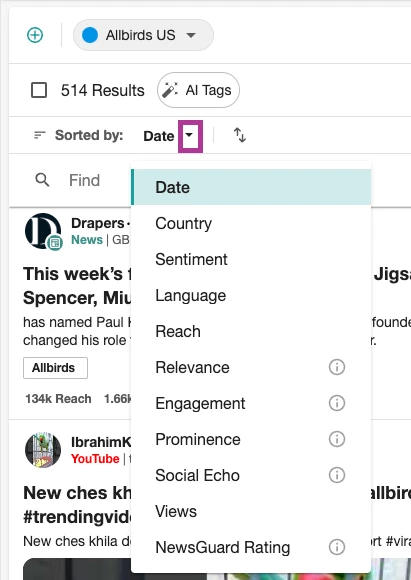
Start scanning the actual mentions under the Volume tab on the left. By default, mentions sort by Date — but try switching to Reach or Engagement to quickly surface the most impactful posts. You’ll see what drove the spike, when it peaked, and where conversation picked up. Read this post to learn more about Sort By options.
-
-
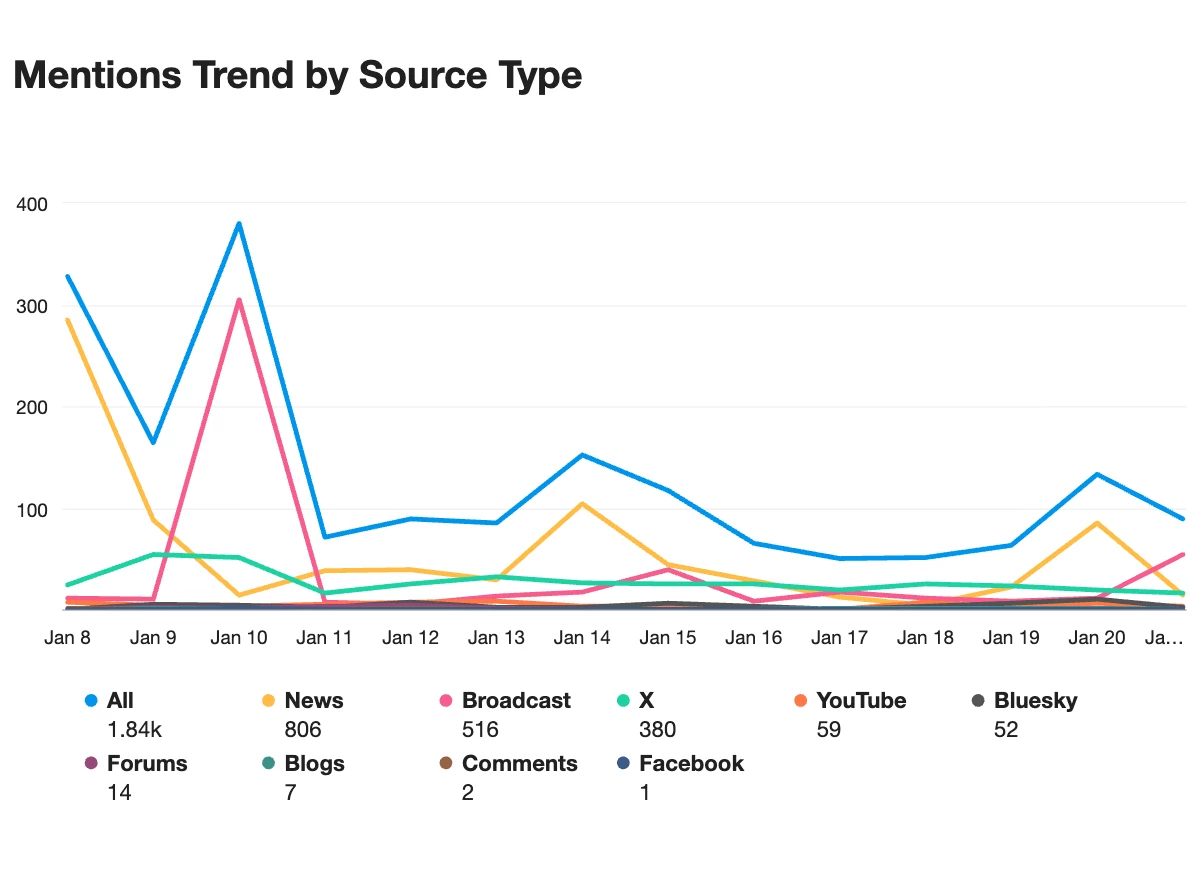
On the Right: Identify What Drove It
-
Top Source Types - Was this spike driven by social posts, news articles, TV or blogs?
-
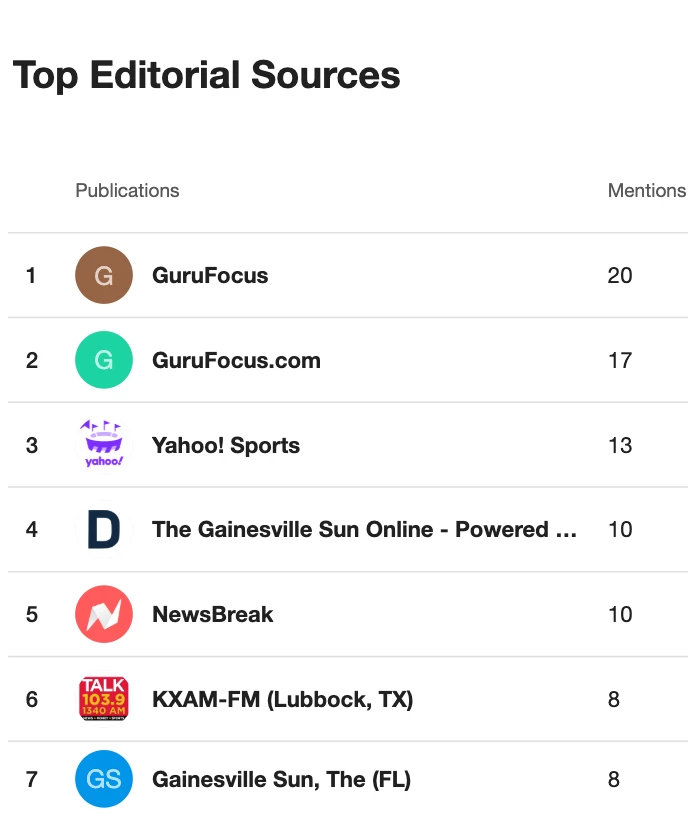
Top Editorial Sources - Which outlets were most accounts?
-
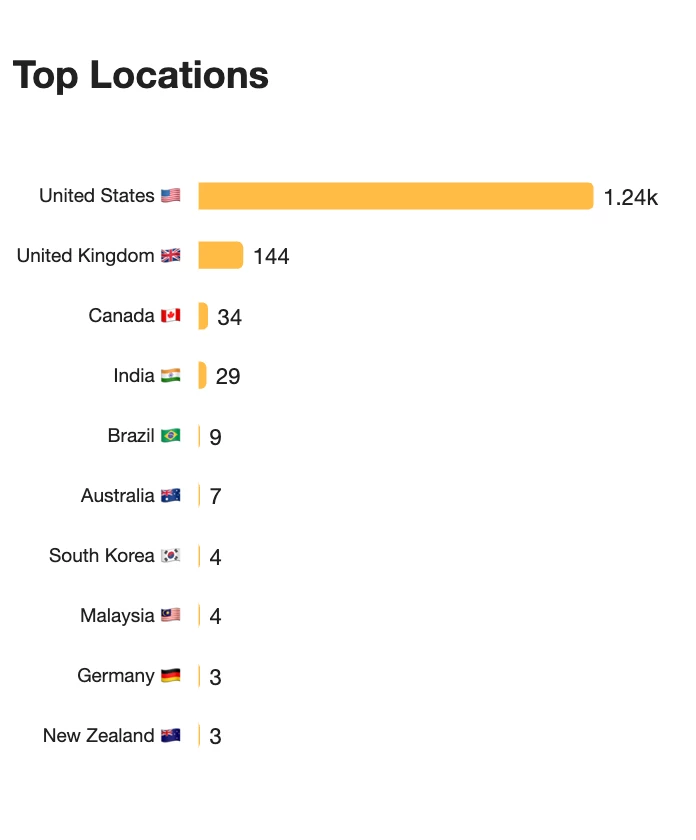
Top Locations - Where was the spike most concentrated?
-
-
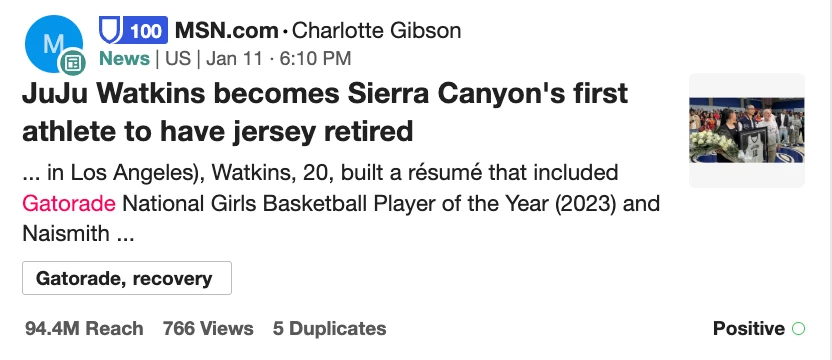
What’s new? — Are there sudden mentions of a player, event, or issue showing up?
Maybe an athlete endorsed by Gatorade made headlines overnight — your spike alert is showing that buzz in real time.
These insights work together to give you a full picture: who was talking, where they were, and how the spike spread.
🏷️ Step 2: Tag Key Mentions for Tracking
Now that you’ve identified what caused the spike, it’s time to organize it. Tags let you group and label mentions so you can quickly analyze trends, report on themes, or revisit key content later.
Here’s how:
-
Scroll through the mentions in the Volume tab.
-
Hover over a mention and click the tag icon (🏷️).
-
Select an existing tag or create a new one.
-
Want to tag in bulk? Use the checkbox to select multiple mentions at once, then tag them all together.
Here are some examples Gatorade’s team might use:
-
Crisis Watch
-
Athlete Endorsement
-
Viral Clips
-
Negative Press
Once your tags are in place, you can use them as data inputs in Analyze — perfect for building dashboards that track trends like “Athlete Endorsement” or “Viral Clips” over time, without digging through searches again.
You can apply tags as you scroll, or in bulk by selecting multiple mentions at once. Learn more on how to Tag in Meltwater here.
📊 Step 3: Build a Spike Tab in Your Dashboard
Once you've tagged the mentions tied to the spike, it's time to visualize what happened.
In Analyze, open your dashboard (or create a new one), then:
-
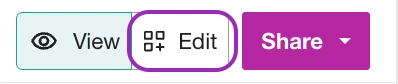
Click Edit in the top right corner.
-
Then click the ➕ icon to Add a new tab — name it something like
Gatorade Spike – Jan 24.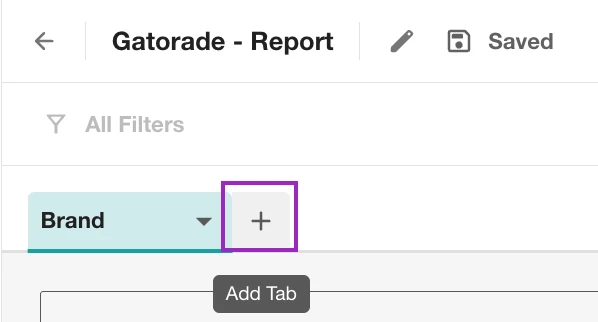
-
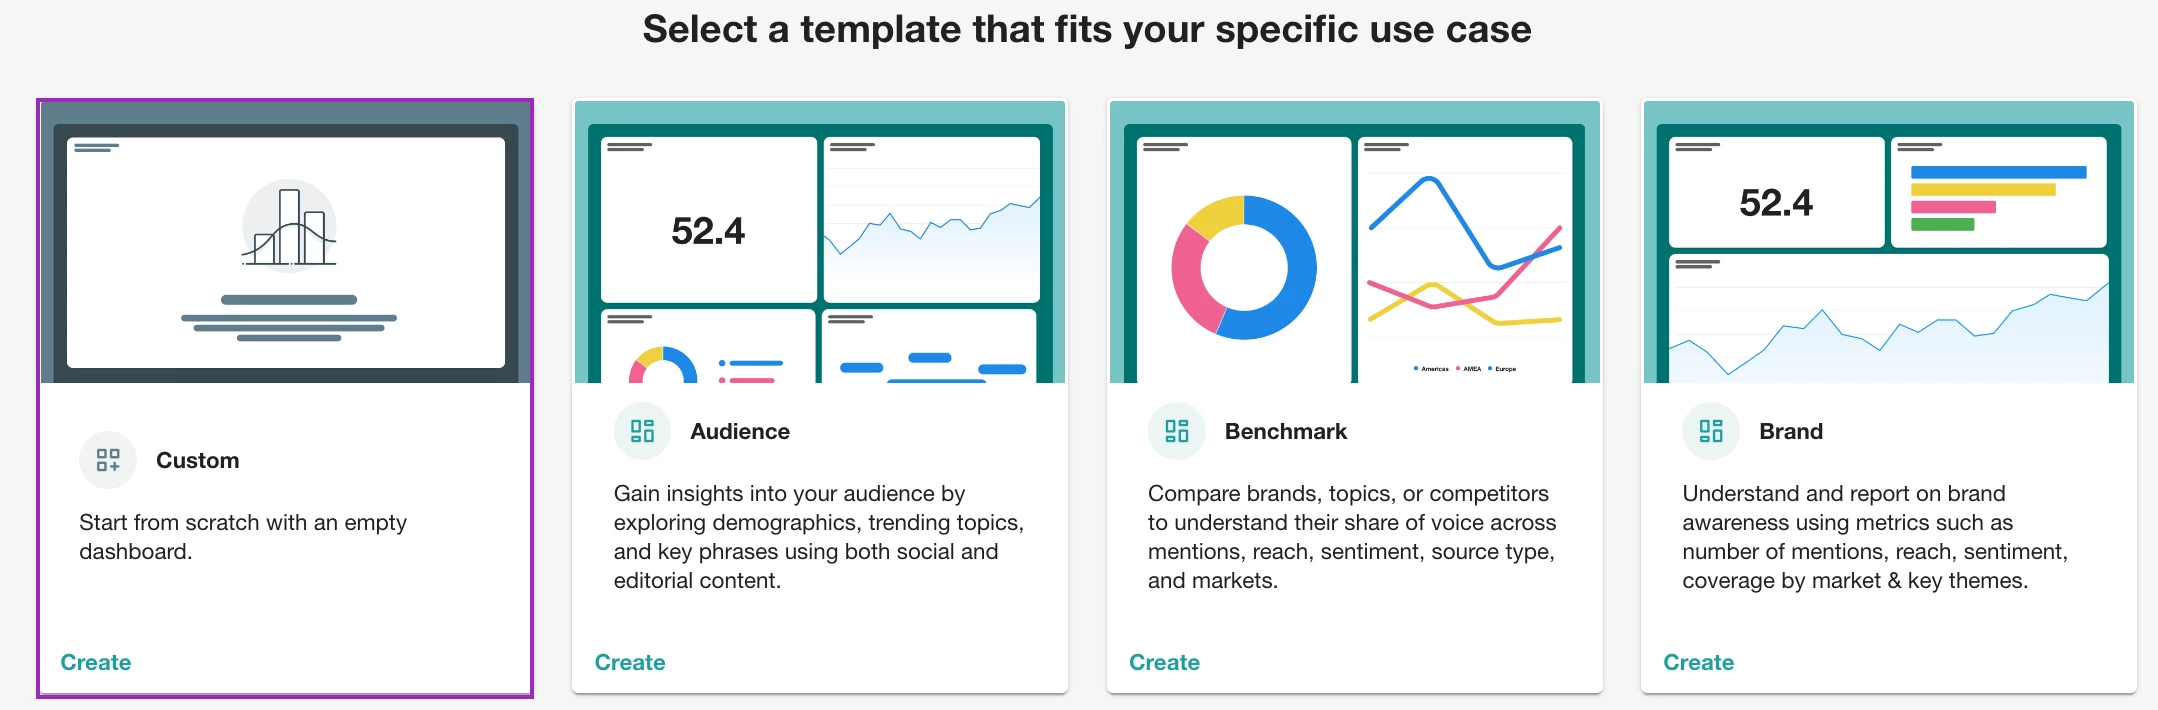
When prompted to select a template, choose Custom, this gives you full control to add only the widgets you want (we’ll recommend some next!)
-
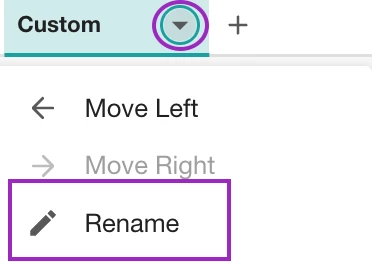
Name your new tab something like:
Spike – Jan 24
You’ll now have a blank slate to visualize what drove the spike in conversation.
Must-Have Widgets for a Spike Tab
These will help you break down what caused the spike, where it took off, and how it landed with audiences.
In the widget catalog (after clicking “+ Add Widget”), use the search bar to find and add the following widgets:
-
Mentions and Reach Trend
→ Track volume over time to pinpoint the exact moment the spike occurred.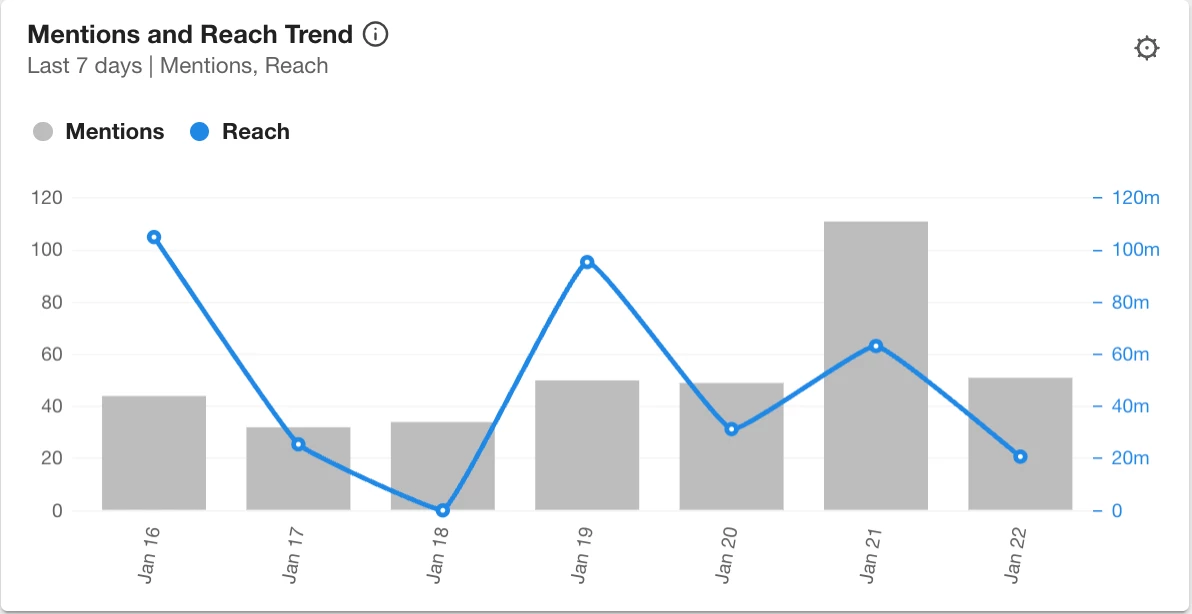
-
Top Keywords
→ Reveal what topics or terms drove the spike. This shows keyword frequency from your tagged mentions.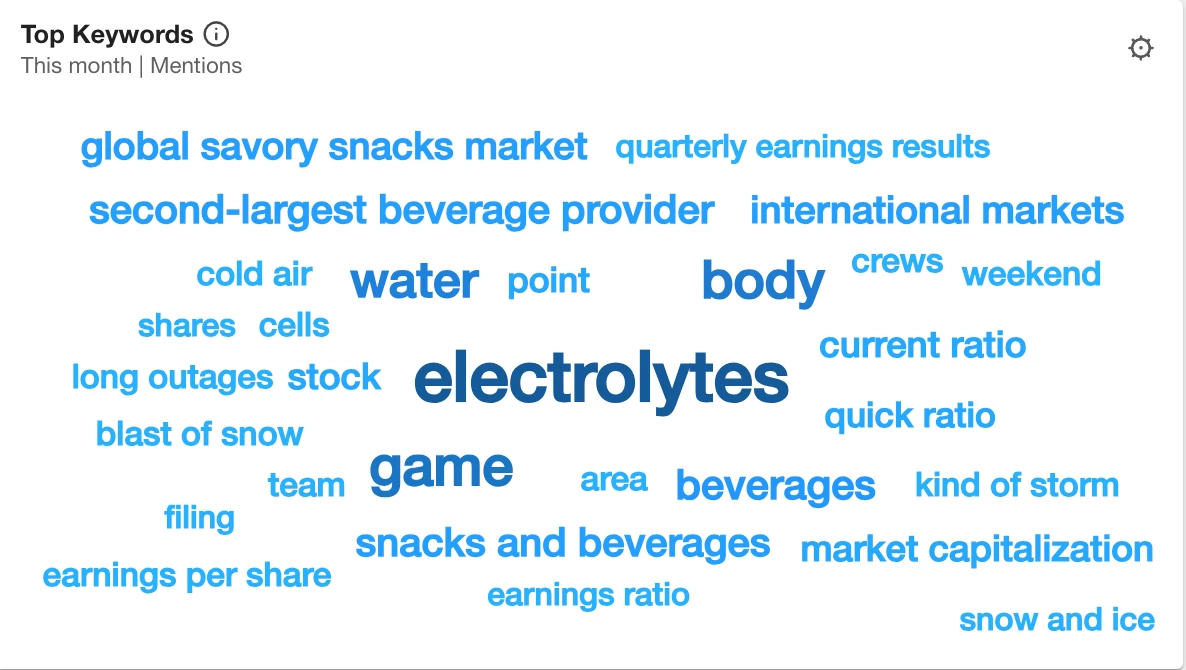
-
AI Summary
→ Get an automated narrative of what the spike was about.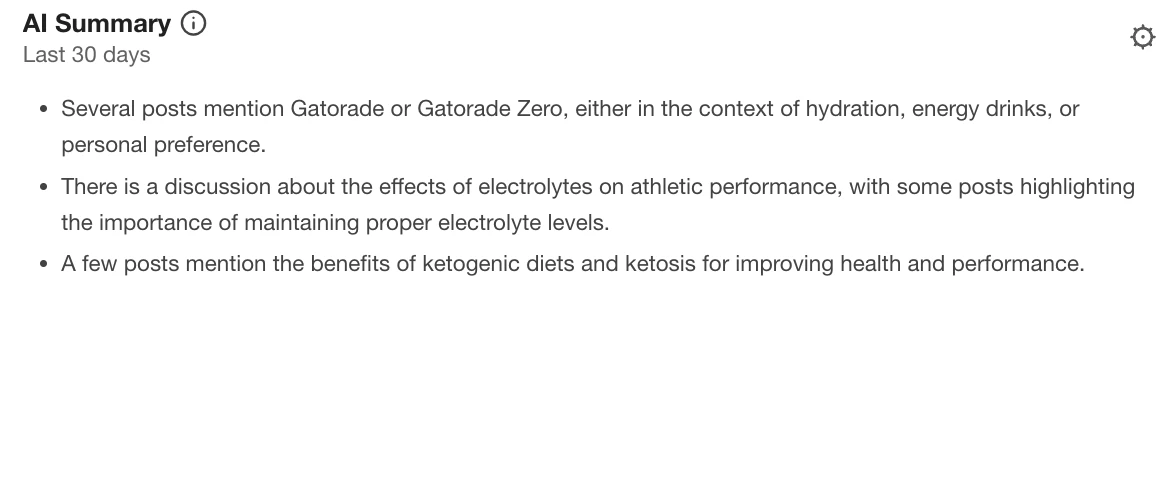
-
Top Mentions
→ Find the most amplified posts—great for identifying what content went viral.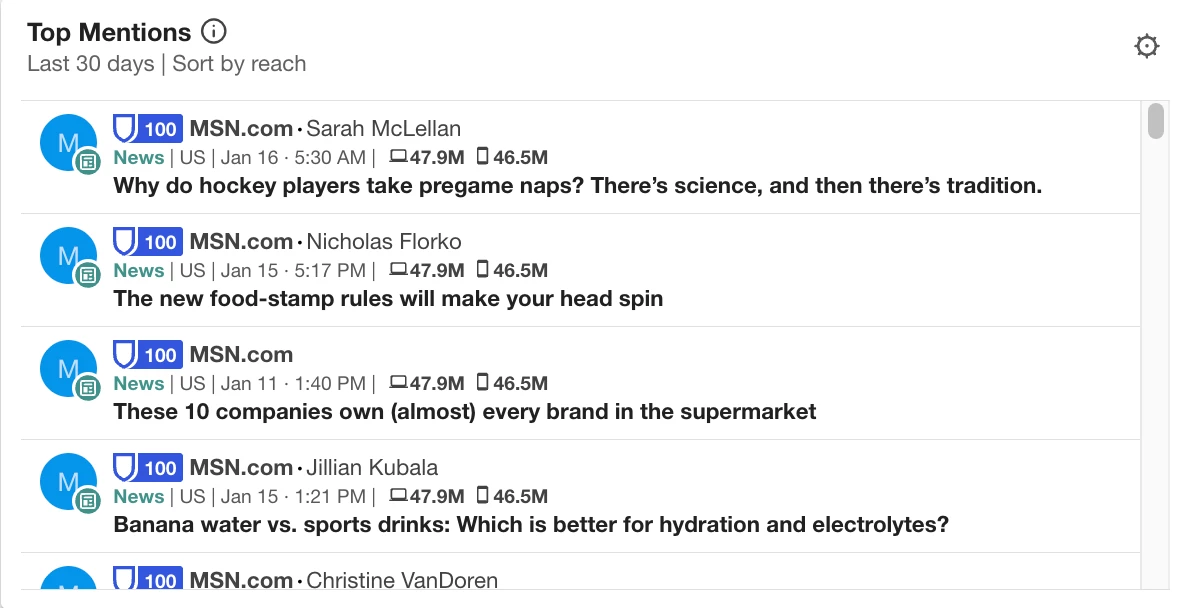
-
Share of Voice by Total Sentiment
→ Monitor positive and negative mentions from the spike. Spot any risk or brand love.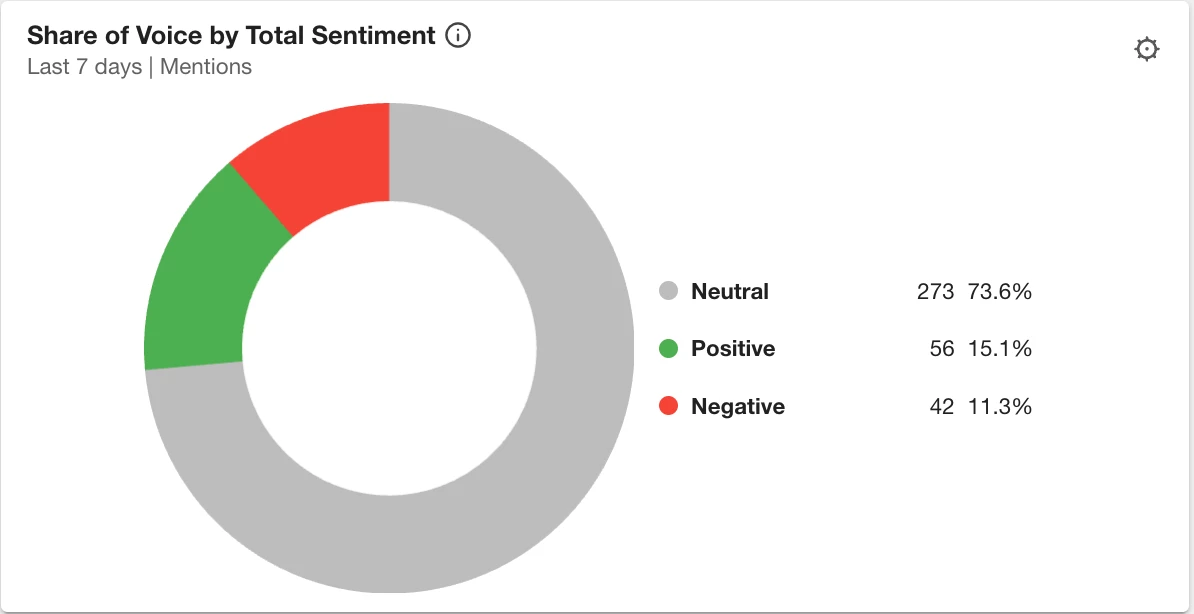
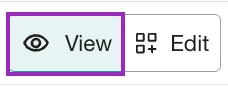
When you’re done, select View in the top right corner and get ready to share!
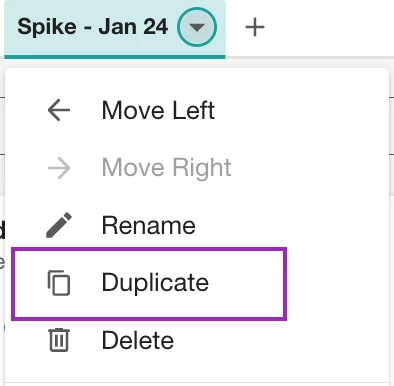
💡 Pro Tip: Built a great tab? Duplicate it to reuse the same widget, just swap in a new tag or date range.
📤 Step 4: Share What You Found
Once your dashboard is ready, it’s time to get it in front of others.
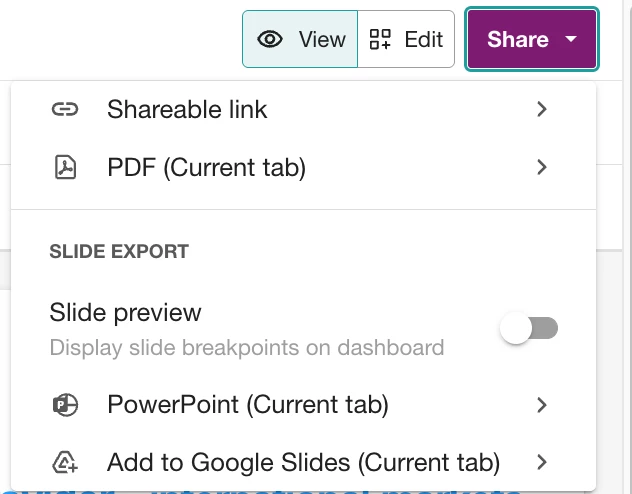
Click the purple Share button in the top-right corner of your dashboard to choose how you'd like to share:
- Shareable link — Copy a live link to your full dashboard. Ideal for real-time monitoring, collaborative reviews, or team Slack channels
- PDF (Current tab) — Export a static PDF of the selected tab. Perfect for attaching in email updates or internal reports
- Slide Export — Useful when presenting data in meetings or quarterly business reviews. Choose to export the current tab only as slides for:
-
PowerPoint
-
Google Slides
-
Learn more about sharing dashboards in this Help Center article.
🗣️What’s Your Go-To Move?
Everyone approaches a spike differently. Maybe you screenshot posts, drop them into Slack, build a deck, tag everything, or just text your team in all caps.
👇 Share your first step, favorite habit, or helpful tip (Meltwater or not!) in the comments.👇