


X (formerly Twitter) is now integrated into Meltwater's Trends Center, giving you real-time visibility into what's capturing attention across one of the world's most influential social platforms. Identify emerging opportunities, track brand mentions, and understand what your audience cares about—all in one place.
This article will cover:
Viewing X Trends in Monitor
To view X Trends in Monitor, follow these steps:
- Click Monitor in the left-hand navigation bar
- If you haven’t created a Monitor Stream, click the Create Monitoring View button (otherwise, skip to step 3).
- Select Trends Center
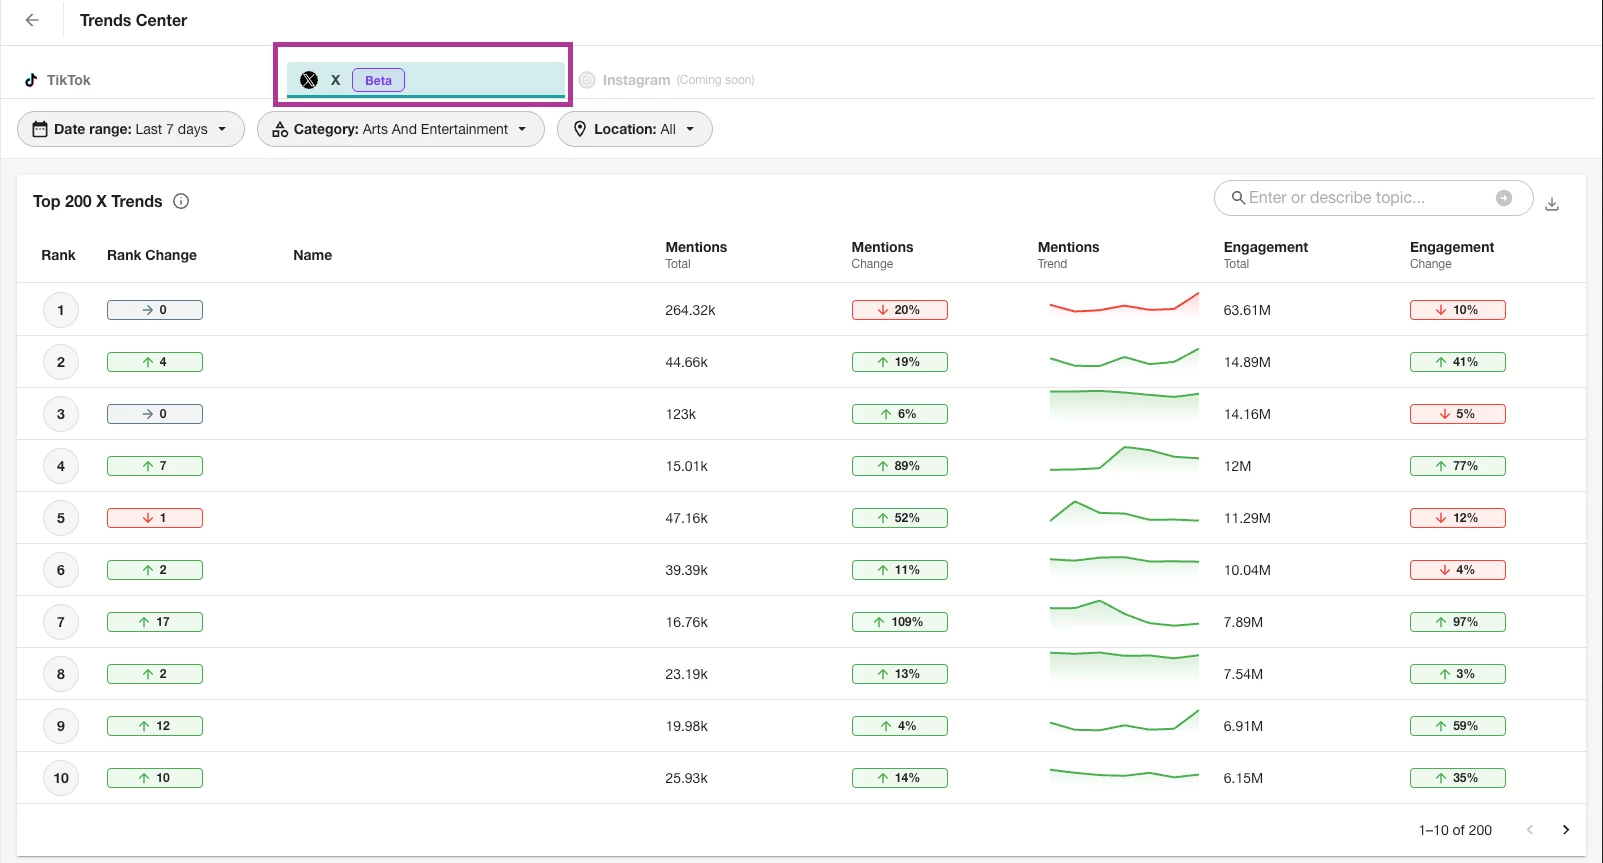
- Click X in the top toolbar
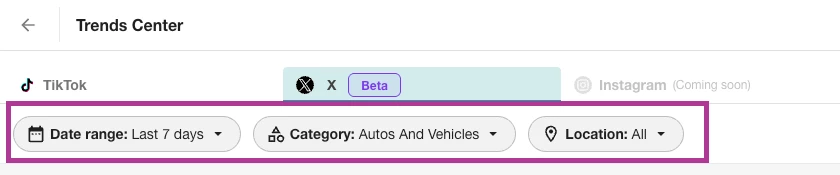
- Use filters to refine your results (see filter options below):
- Country (Select from 246 available regions)
- Category (View trends by industry or interest)
- Date Range (Choose from 7 or 30 days)
Viewing Top X Trends in Trends Center
To view a list of the most viewed posts related to the selected hashtag, follow these steps:
- Click Monitor in the left-hand navigation bar
- Select Trends Center
- Click X in the top toolbar
- Click into any trend on any graph to view an X Trend in the right-hand slide-out. This will feature two tabs: Top Content and Analytics
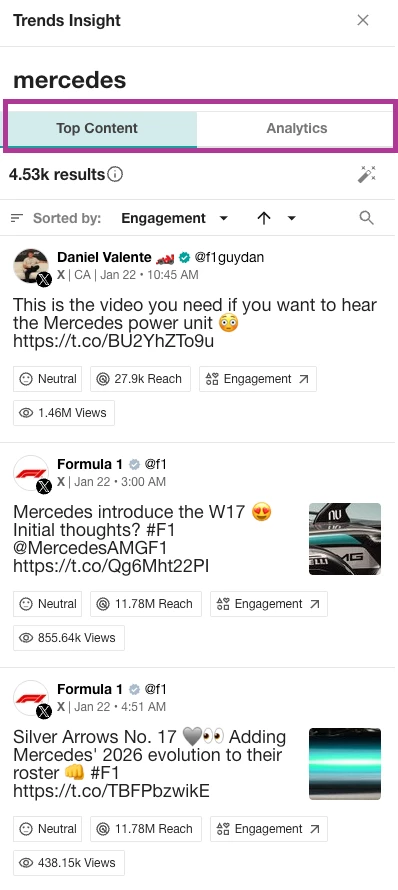
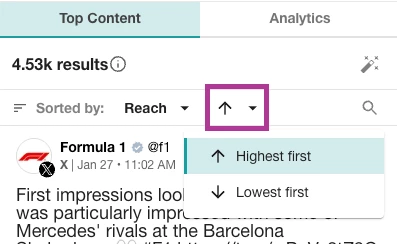
Top Content
Similar to Explore content streams, this features top posts associated with the X Trend. Sort results by:
- Reach: Estimated the potential viewership of a specific article based on the number of monthly unique visitors to the source.
- Engagement: Displays items that have the highest aggregated engagement numbers.
- Date
- Relevance: Displays the most applicable items first. Relevance is based on an algorithm that takes the prominence, reach, and age of the article into account.
- Views
- Social Echo
- NewsGuard Rating: Reliability ratings for new outlets based on nonpartisan journalistic criteria.
- Sentiment: Assesses the opinion expressed in a body of text, categorizing it as Positive, Negative, or Neutral.
- Prominence: Prominence, also known as term frequency, means how many times a particular word appears in a text, divided by how many words exist in the text.
- Country: Displays items by their country
- Language
Additionally, display results by highest/newest first or lowest/oldest first by clicking the arrow:
Analytics
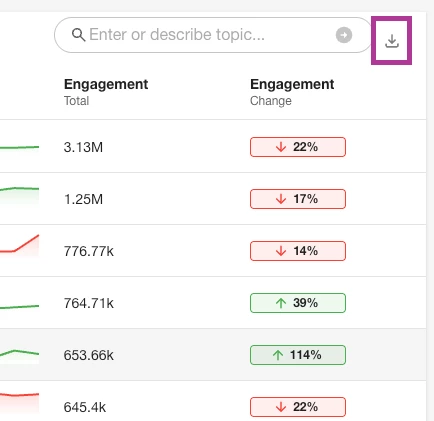
The Analytics tab features seven widgets:
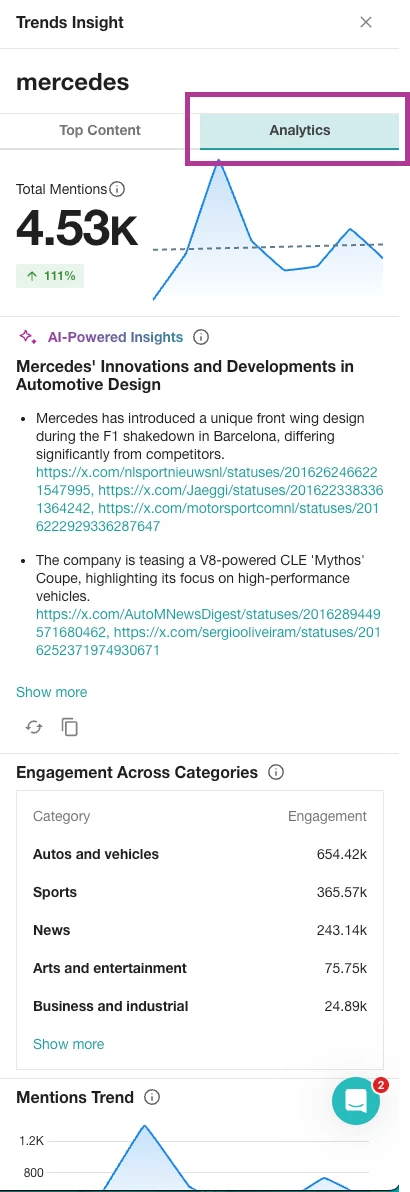
- Total Mentions: The total volume of conversation associated with this trend during the date range. This count - and all other calculations on the Analytics tab - does NOT include conversations within the current day.
- AI-Powered Insights: Automatically generated insights highlighting notable shifts, spikes, or patterns in conversation. These summaries are derived from volume changes, keyword co-occurrence, and engagement signals.
- Engagement Across Categories: The categories with the most amount of engagement across sources. YouTube data is excluded from this visualization per their policies.
- Mentions Trend: Shows how mention volume for the selected topic changes over time within the current date range. This chart reflects only posts associated with this topic, not overall platform or category activity. Use it to identify spikes, sustained growth, or drop-offs in attention and to connect changes back to specific content or events.
- Top Locations: Shows where the majority of conversation for this topic originates. Locations are inferred from author metadata and content signals. For some content the location cannot be derived, these will be listed in a separate column called ‘unknown region’
- Top Keywords: The most frequently associated keywords appearing alongside this topic. Useful for understanding context, themes, and sub-trends.
- Sentiment: Displays the emotional tone of content mentioning this topic.
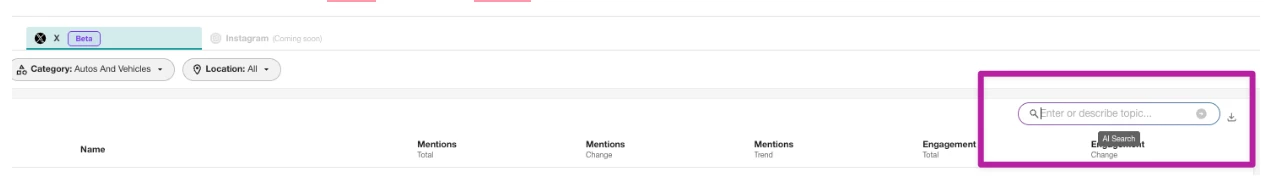
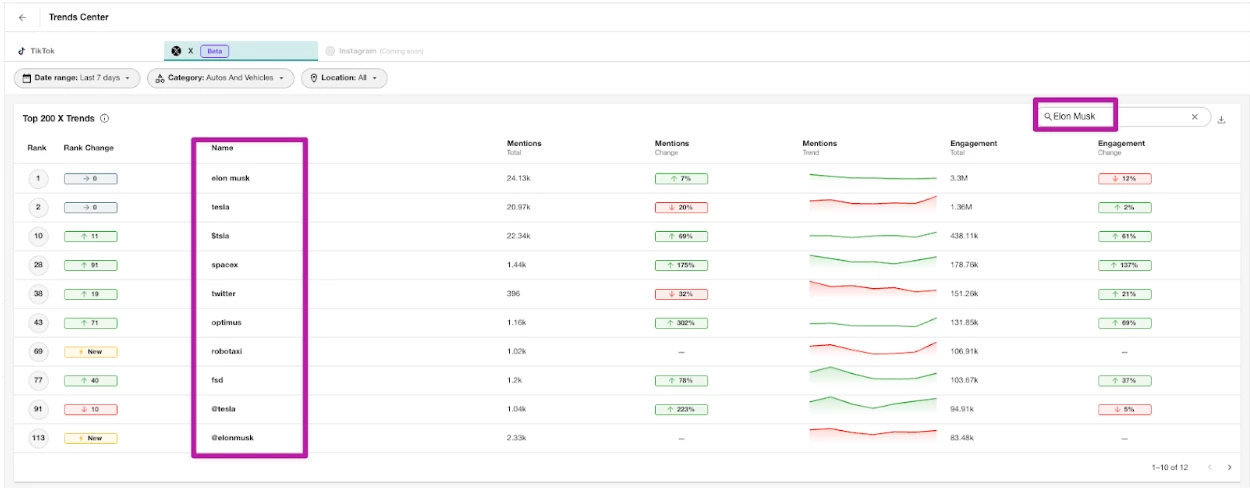
Using the AI-Powered Search
To use the AI-Powered Search, follow these steps:
- Click the Monitor drop-down in the left-hand navigation bar
- Select Trends Center
- Navigate to any trends tab. On the right-hand side, you’ll find the option to search the results
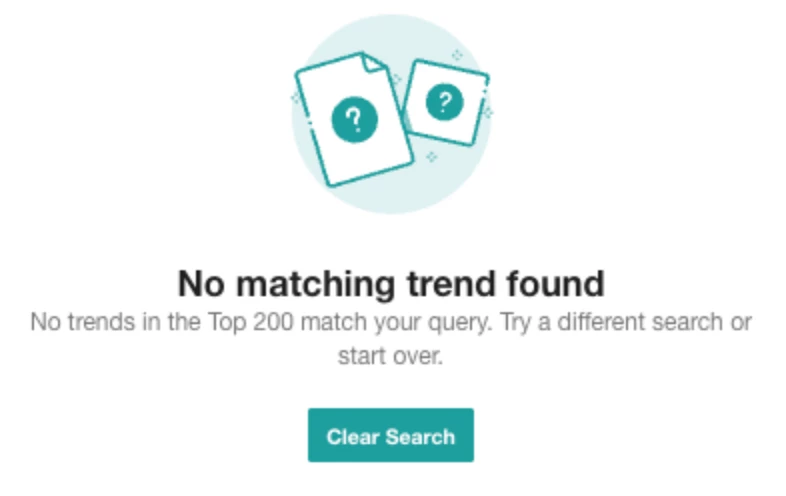
Note: if you attempt to search for a keyword or phrase that doesn’t match your filters, then the search will return the error message below. Click Clear Search to search again.
- After a successful search, we’ll show the trending topics related to the search term
Exporting X Trends
To export X Trends from Trends Center, follow these steps:
- Click Monitor in the left-hand navigation bar
- Select Trends Center
- Click X in the top toolbar
- Navigate to the Top X Trends graph
- Click Download CSV
- Your CSV will download to your computer
Filter Options
Countries Available (246)
Select from 246 available regions (defaults to the United States).
AD, AE, AF, AG, AI, AL, AM, AO, AQ, AR, AS, AT, AU, AW, AX, AZ, BA, BB, BD, BE, BF, BG, BH, BI, BJ, BL, BM, BN, BO, BQ, BR, BS, BT, BV, BW, BY, BZ, CA, CC, CD, CF, CG, CH, CI, CK, CL, CM, CN, CO, CR, CU, CV, CX, CY, CZ, DE, DJ, DK, DM, DO, DZ, EC, EE, EG, EH, ER, ES, ET, FI, FJ, FK, FM, FO, FR, GA, GB, GD, GE, GF, GG, GH, GI, GL, GM, GN, GP, GQ, GR, GS, GT, GU, GW, GY, HK, HM, HN, HR, HT, HU, ID, IE, IL, IM, IN, IO, IQ, IR, IS, IT, JE, JM, JO, JP, KE, KG, KH, KI, KM, KN, KP, KR, KW, KY, KZ, LA, LB, LC, LI, LK, LR, LS, LT, LU, LV, LY, MA, MC, MD, ME, MG, MH, MK, ML, MM, MN, MO, MP, MQ, MR, MS, MT, MU, MV, MW, MX, MY, MZ, NA, NC, NE, NF, NG, NI, NL, NO, NP, NR, NU, NZ, OM, PA, PE, PF, PG, PH, PK, PL, PM, PN, PR, PS, PT, PW, PY, QA, RE, RO, RS, RU, RW, SA, SB, SC, SD, SE, SG, SH, SI, SJ, SK, SL, SM, SN, SO, SR, SS, ST, SV, SY, SZ, TC, TD, TF, TG, TH, TJ, TK, TL, TM, TN, TO, TR, TT, TV, TW, TZ, UA, UG, UM, US, UY, UZ, VA, VC, VE, VG, VI, VN, VU, WF, WS, YE, YT, ZA, ZM, ZW
Date Range
Select between 7 and 30 days.
Categories Available
Categories are inferred using keyword context, hashtags, and content metadata to group related discussions. Categories are hierarchical, so that trends can be calculated across 3 tiers (e.g., Tier I - Beauty and Fitness, Tier II - Hair Care or Tier III - Hair Loss).
Full List of Categories
- Arts and Entertainment
- Autos and Vehicles
- Beauty and Fitness
- Books and Literature
- Business and Industrial
- Computers and Electronics
- Finance
- Food and Drink
- Games
- Health
- Hobbies and Leisure
- Home and Garden
- Internet and Technology
- Jobs and Education
- Law and Government
- News
- Online Communities
- People and Society
- Pets and Animals
- Real Estate
- Reference
- Science
- Sensitive Subjects
- Shopping
- Travel
X Trends Center Use Cases
- Marketing Teams: Optimize campaign timing by leveraging rising trends
- Social Media Managers: Create content that taps into timely, high-impact conversations
- PR Professionals: Monitor public sentiment, identify early crisis signals, and spot media opportunities
- Brand Strategists: Align messaging with cultural moments and audience interests
- Competitive Intelligence Analysts: Track competitor activity within trending discussions and uncover white space