


AI-Powered Insights and Reach Trend: Best Practices in Understanding and Sharing the Data
You usually don’t hear from me twice in one week, but when we have a product update like this one, I can’t resist!
On Monday, you might have noticed two new widgets in your Explore Classic Analytics…
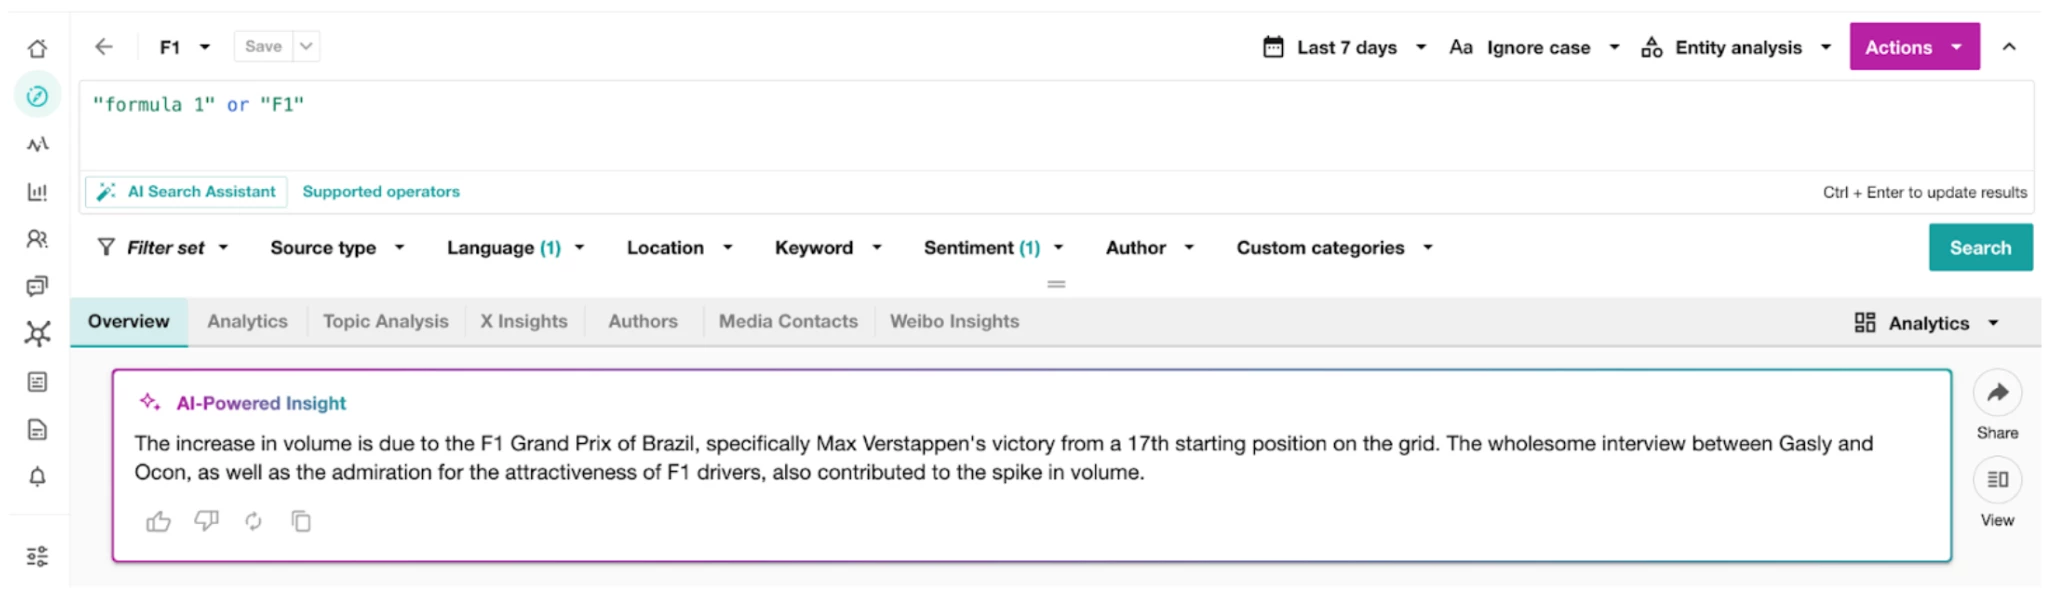
AI-Powered Insights
Reach Trend

Our product team continues to make strides toward empowering PR and Marketing professionals to make educated decisions in various situations, and that’s exactly what these two new widgets do.
You can learn more about AI-Powered Insights and Reach Trend, but today I want to share some best practices for both. So let’s get started!
AI-Powered Insights
According to Forrester, over half of marketers are already using AI to shape marketing strategies. Whether you’re familiar with using AI-generated content at work or still helping your organization learn to adopt it, these are tips for including AI Insights from Explore in your reporting.
- Use Copy-Paste-Friendly Summaries
- AI-Powered Insights are designed to be ready-made for reports, making them easy to paste into slides or executive summaries. This helps speed up reporting time and ensures accuracy when summarizing key takeaways.

- Visually Identify Artificially Powered Content When Reporting
- Use a dedicated slide or report section to highlight insights as explanations for observed trends. Label the section clearly, such as AI-Powered Insight: Drivers Behind Mention Increase, to make it easier for stakeholders to connect data points with causal factors.
- Use an icon when including AI-powered or AI-generated content in your slides, allowing your audience to quickly identify where AI helped you save time and do the heavy lifting.
- Know your data providers’ stance on Safety and Ethics in AI and include links to relevant articles in your report appendix for readers who want to know more AI trustworthiness.
- Add a Regular AI Insights Summary Section to Reports and Label them as Key Drivers
- Make AI-Powered Insights a recurring part of your report, dedicating a section to these insights so stakeholders can expect regular updates on emerging trends and patterns. Label it as AI-Powered Insights to reinforce that these are automatically generated insights that help speed up analysis. Additionally, labeling these insights as Key Drivers helps signal to stakeholders that the insight highlights the main elements driving changes in mentions or sentiment.
- Example Section Title: Monthly AI Insights: Key Patterns in Mentions for [Search]
- Incorporate other insights and metrics powered by artificial intelligence from across the Meltwater product suite.
- Learn more about Writing a Marketing Report.
- Make AI-Powered Insights a recurring part of your report, dedicating a section to these insights so stakeholders can expect regular updates on emerging trends and patterns. Label it as AI-Powered Insights to reinforce that these are automatically generated insights that help speed up analysis. Additionally, labeling these insights as Key Drivers helps signal to stakeholders that the insight highlights the main elements driving changes in mentions or sentiment.
Reach Trend
If your report readers are not familiar with Reach as a metric or they haven’t seen it presented as a trend before, I suggest guiding them with the following best practices that make it easy to interpret and act on Reach Trend insights.
- Define the Metric in Your Report Introduction
- When introducing the Reach Trend, start with a clear definition to set expectations.
- Example: The Reach Trend captures the total reach of mentions and the percentage change in reach compared to the previous period. This metric reflects the potential audience size for mentions across platforms.
- When introducing the Reach Trend, start with a clear definition to set expectations.
- Date-Stamp New Metrics
- Add a footnote or annotation indicating when Reach Trend was added to the report. This can help users track changes over time and understand why specific metrics may appear only in recent reports.
- Example Footnote: Reach Trend was introduced to this report on [specific date] to provide additional context around audience exposure
- Add a footnote or annotation indicating when Reach Trend was added to the report. This can help users track changes over time and understand why specific metrics may appear only in recent reports.
- Contextualize Reach with Platform Insights
- Reach can vary significantly across platforms (e.g., X vs. news sites). Include a breakdown of reach by platform or mention the dominant platform contributing to high reach. Platform or filter-based Reach Trend analysis can be done by applying a source-type filter. Learn more about Source Type.
- Example: The majority of reach for this period is attributed to news outlets, indicating high visibility across significant media.
- Reach can vary significantly across platforms (e.g., X vs. news sites). Include a breakdown of reach by platform or mention the dominant platform contributing to high reach. Platform or filter-based Reach Trend analysis can be done by applying a source-type filter. Learn more about Source Type.
- Incorporate Visuals for Trend Context
- Use visualizations, such as screenshots or downloaded PNGs. You can see the comparison between Mentions and Reach trends when viewing the charts together. This comparison can help show how audience exposure fluctuates concerning key events.
- Example: The Reach Trend chart shows that audience exposure increased by 40% following the product announcement, indicating strong visibility among target audiences. This was powered by only a handful of high-visibility posts, keeping our Mentions steady for the same period.
- Use visualizations, such as screenshots or downloaded PNGs. You can see the comparison between Mentions and Reach trends when viewing the charts together. This comparison can help show how audience exposure fluctuates concerning key events.

- Add a Note on Interpretation
- In cases where reach numbers may seem large, include a clarifying note to ensure stakeholders understand the context. Reach is an estimated potential audience size, best interpreted as an indicator of visibility rather than a precise count.
- Example Note: Reach reflects estimated potential audience size and is most useful for tracking general visibility trends rather than absolute audience counts
- In cases where reach numbers may seem large, include a clarifying note to ensure stakeholders understand the context. Reach is an estimated potential audience size, best interpreted as an indicator of visibility rather than a precise count.
In short, these widgets are meant to enhance reporting clarity, accessibility, and stakeholder engagement by structuring insights for quick comprehension and actionable context. Add these insights to your next report, and let us know how they resonated with your key stakeholders in the comments below.