

🍭 Which Candy Brand is Winning Halloween?
Whether you’re new to Meltwater or just creeping into Unified Dashboards for the first time, building a Benchmark Report doesn’t have to be scary. In this spooky season, we’ll show you how to conjure up a candy brand showdown using our Benchmark dashboard template
Let’s say you’re tracking some of the biggest names in the candy aisle like Hershey’s vs. Skittles vs. Haribo — and you want to compare them side by side to see who’s getting the most buzz.
Let’s unwrap it step-by-step:
Step 1: Start with Saved Searches
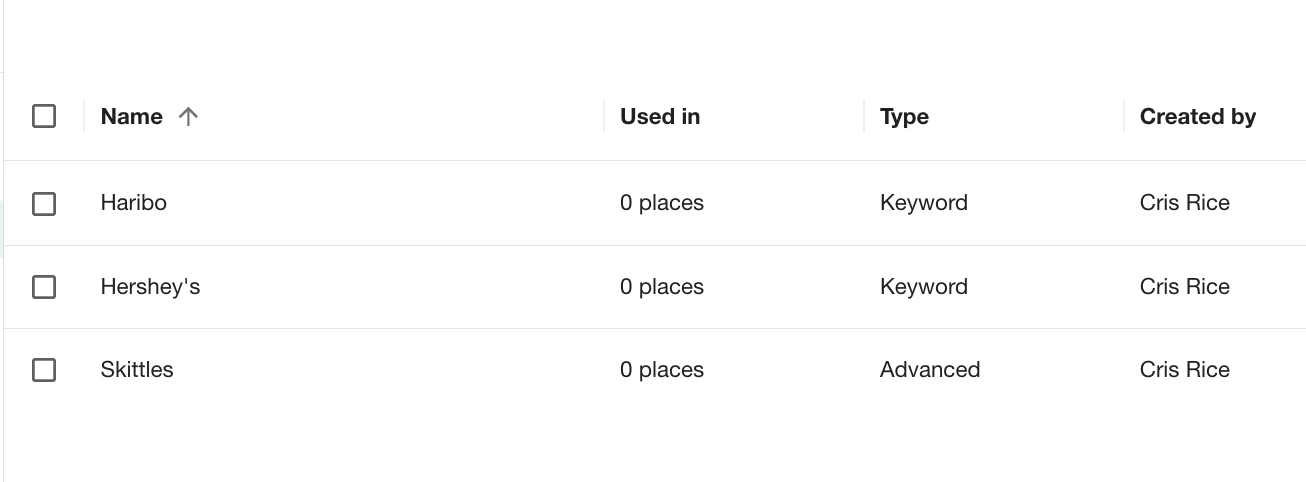
Before you can benchmark anything, you need to be tracking each candy brand.
Head to Explore from the left-hand navigation menu and create a Saved Search for each brand:
- Hershey’s
- Skittles
- Haribo
- (or your own mix of favorites!)
Need help building brand searches? Check out our Brand Monitoring Toolkit
🍬 Step 2: Create Your Benchmark Dashboard
- Go to Analyze from the left-hand navigation menu
- Click Create Unified Dashboard
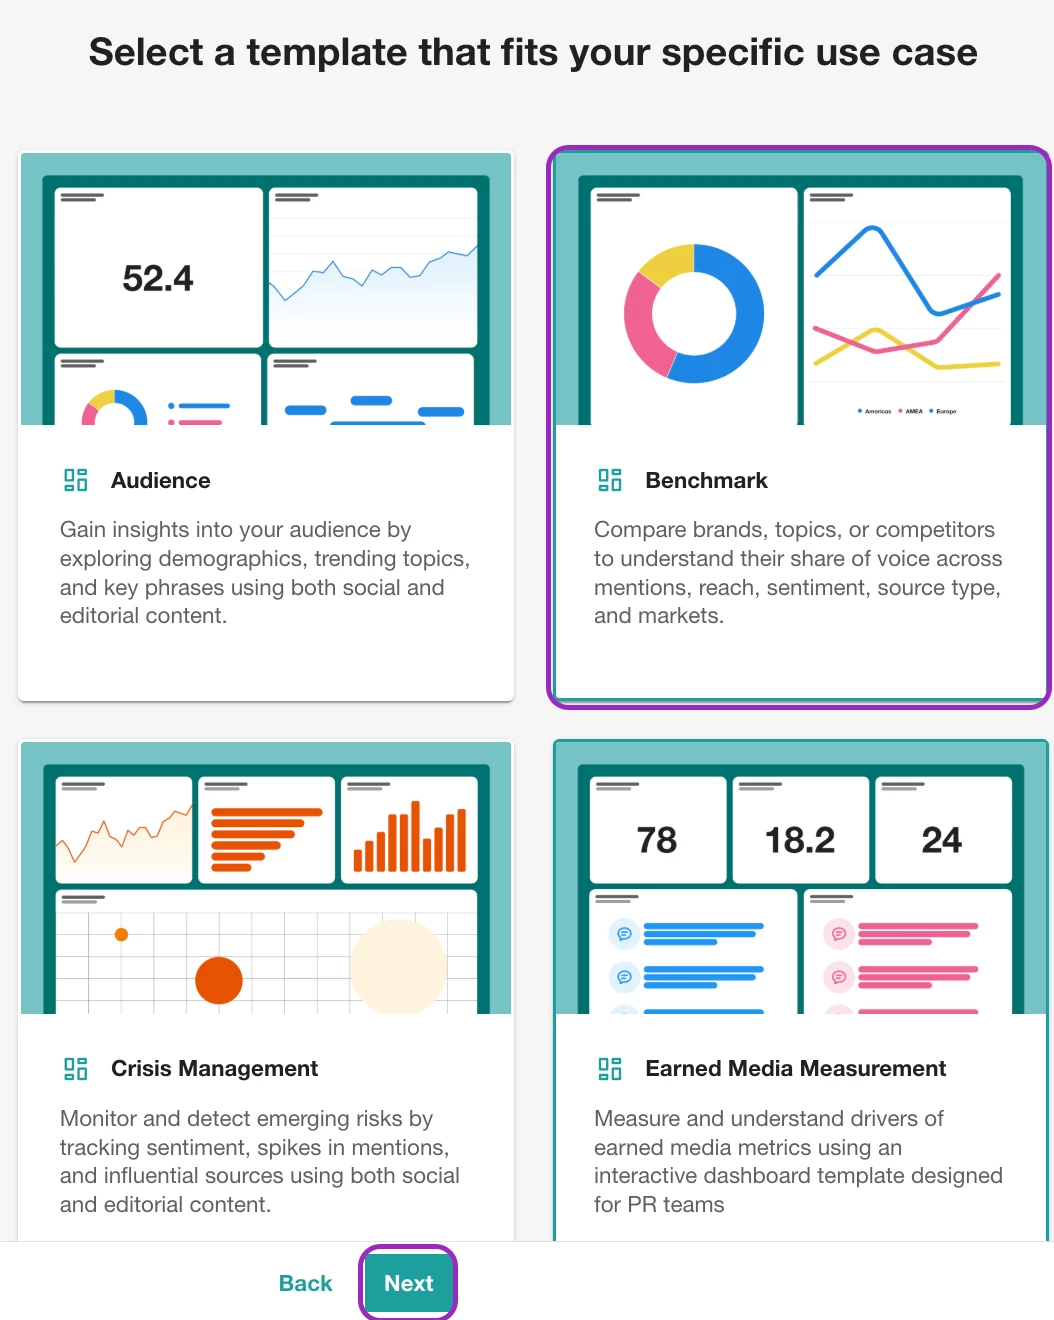
- Select the Benchmark template and hit Next
- Select the Saved Searches (or Tags) you just made and click Next
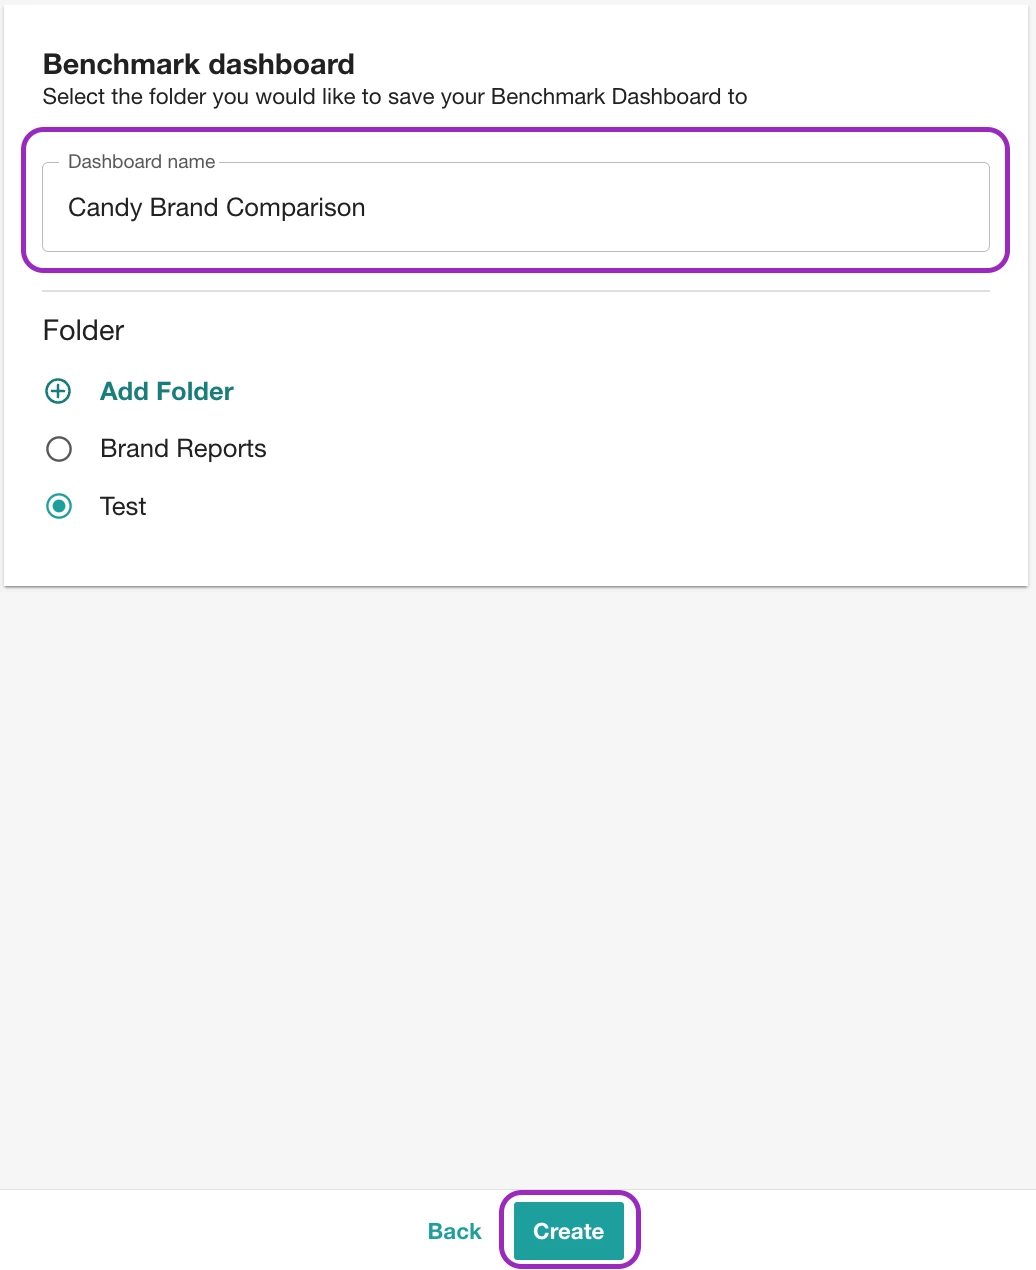
- Name it something like “Candy Brand Comparison” and hit Create
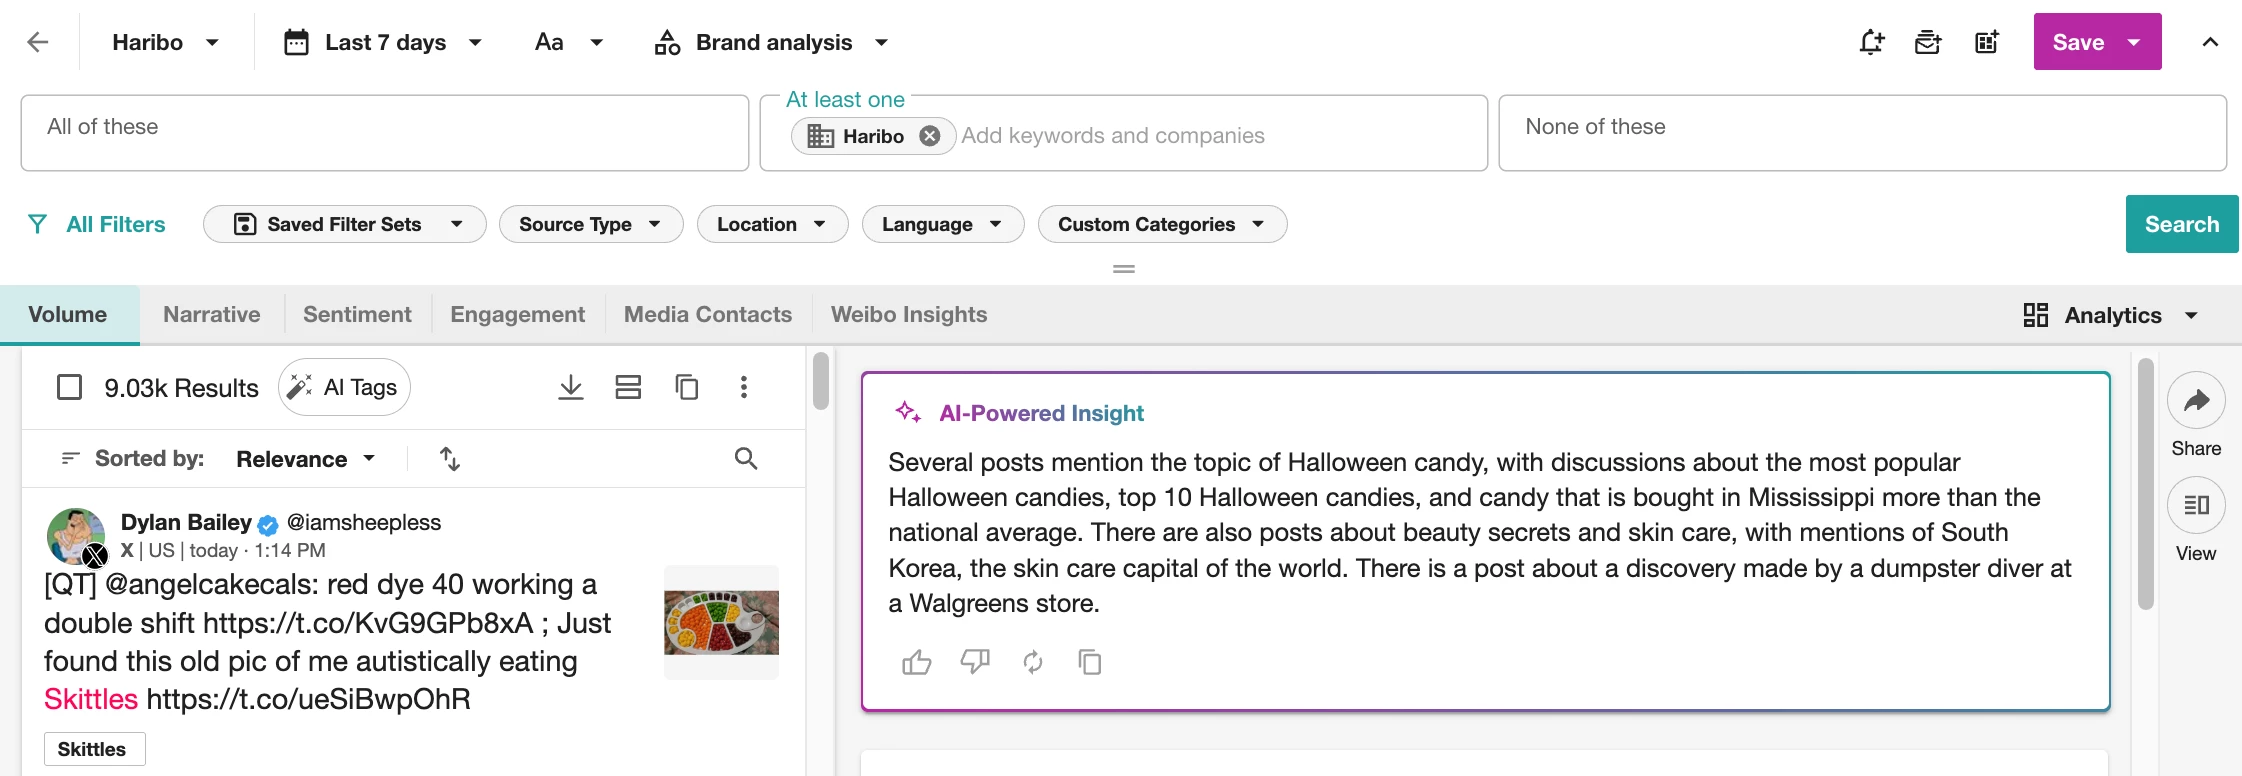
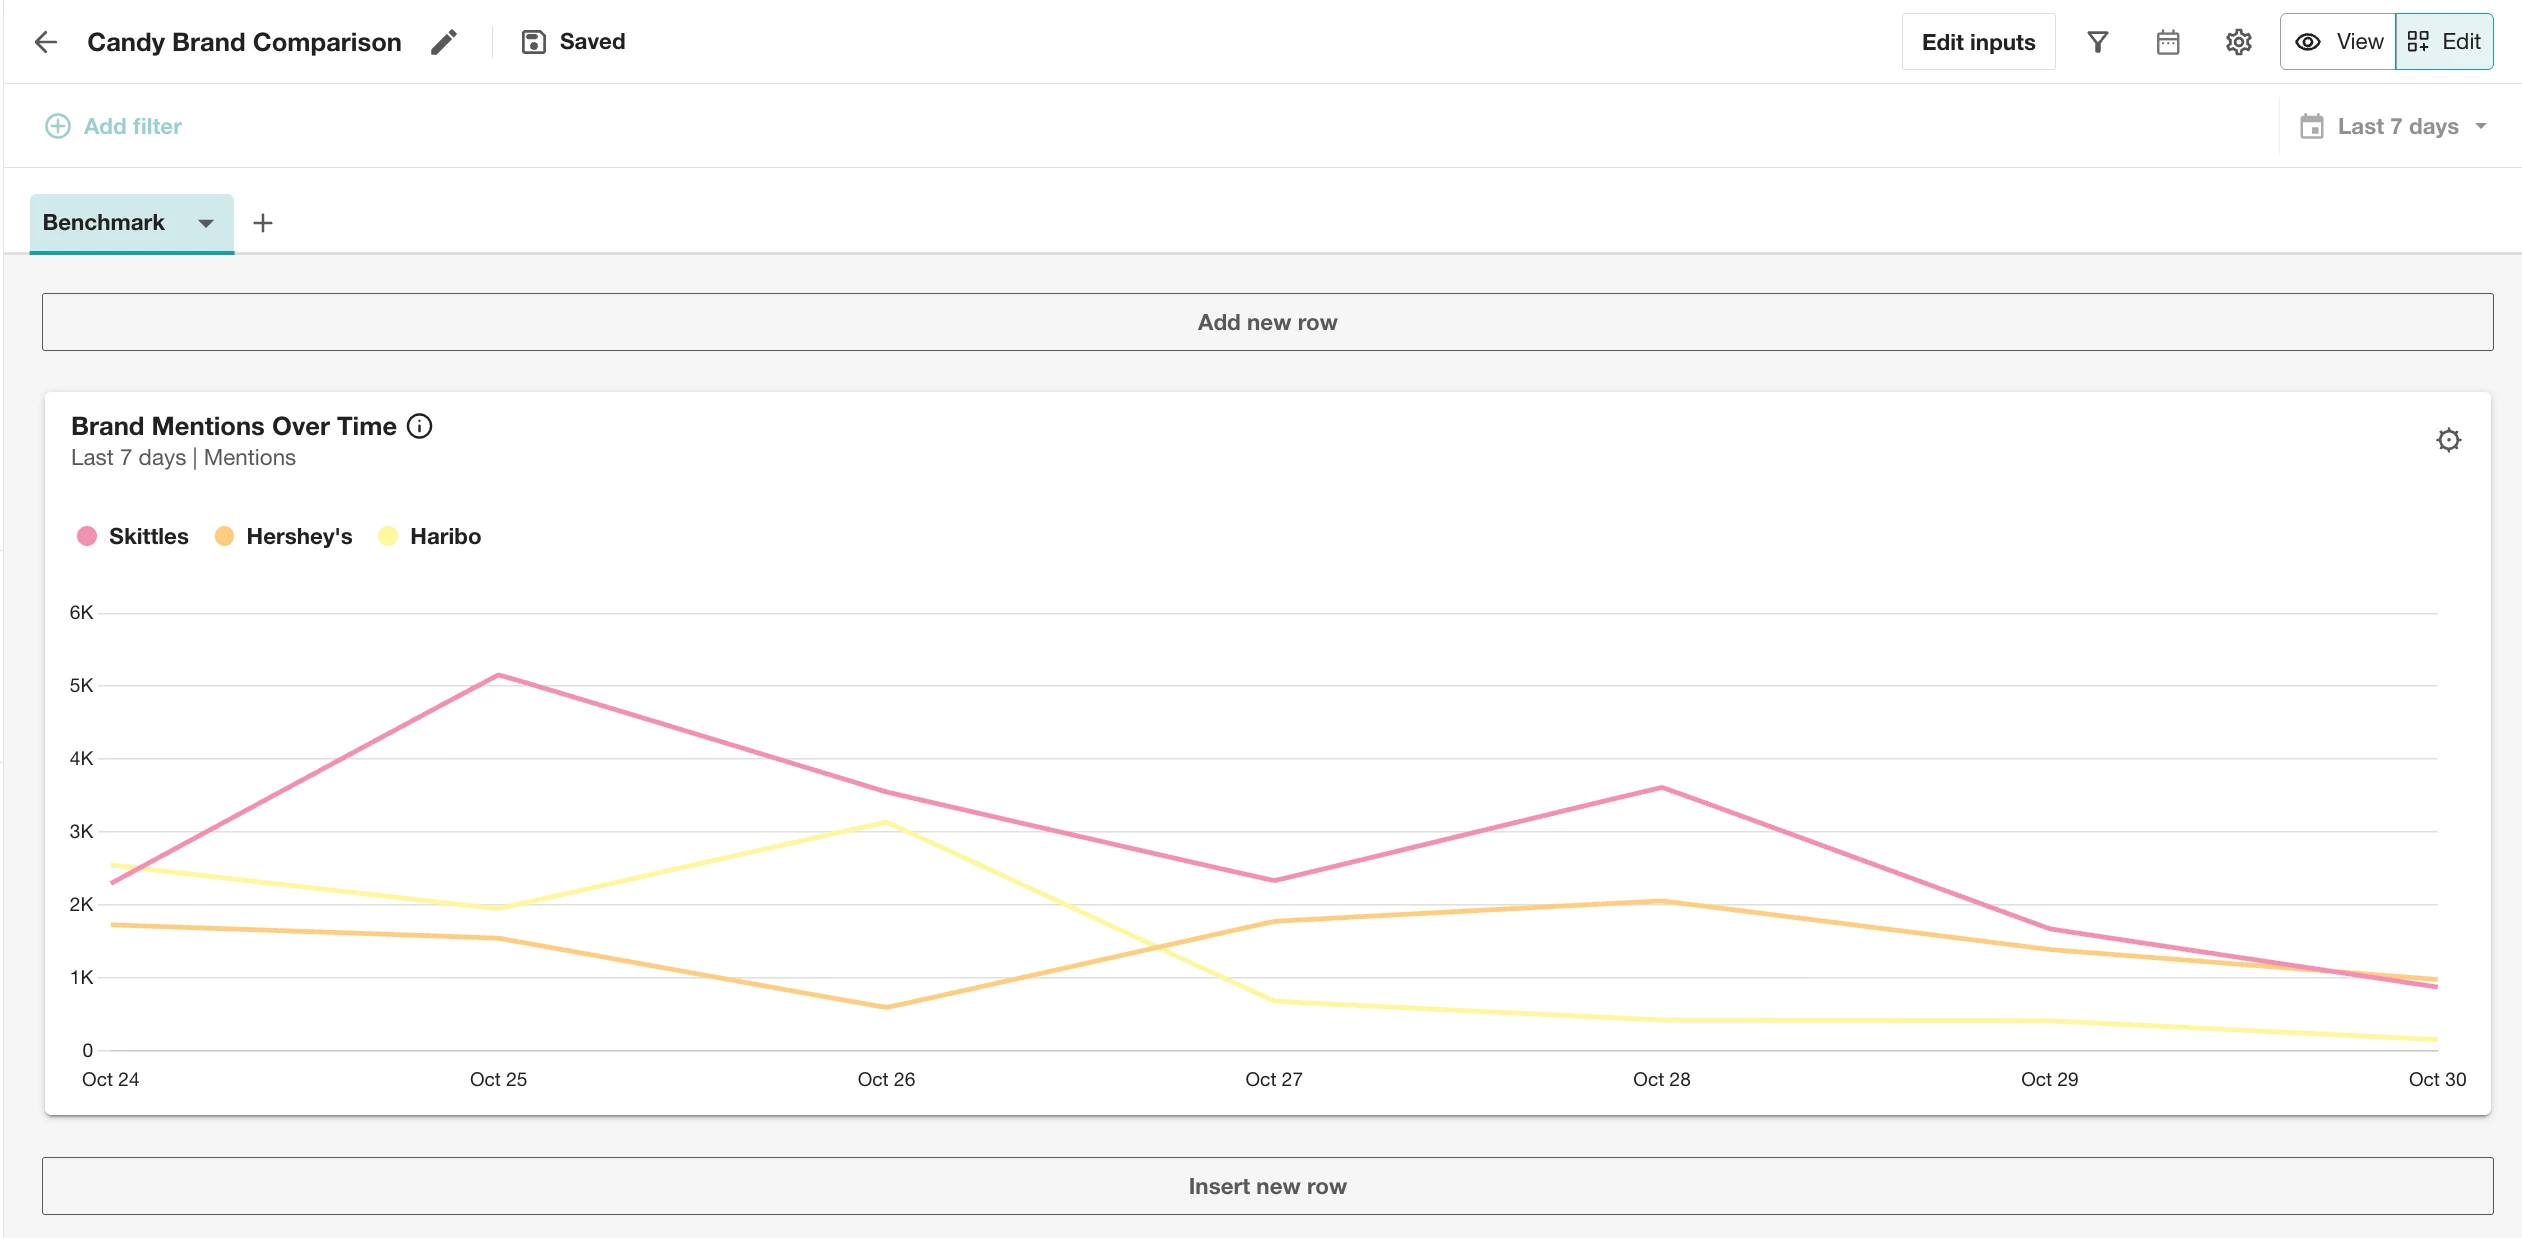
Step 3: Watch the Treats Compete
Instantly see who’s winning the Halloween spotlight:
-
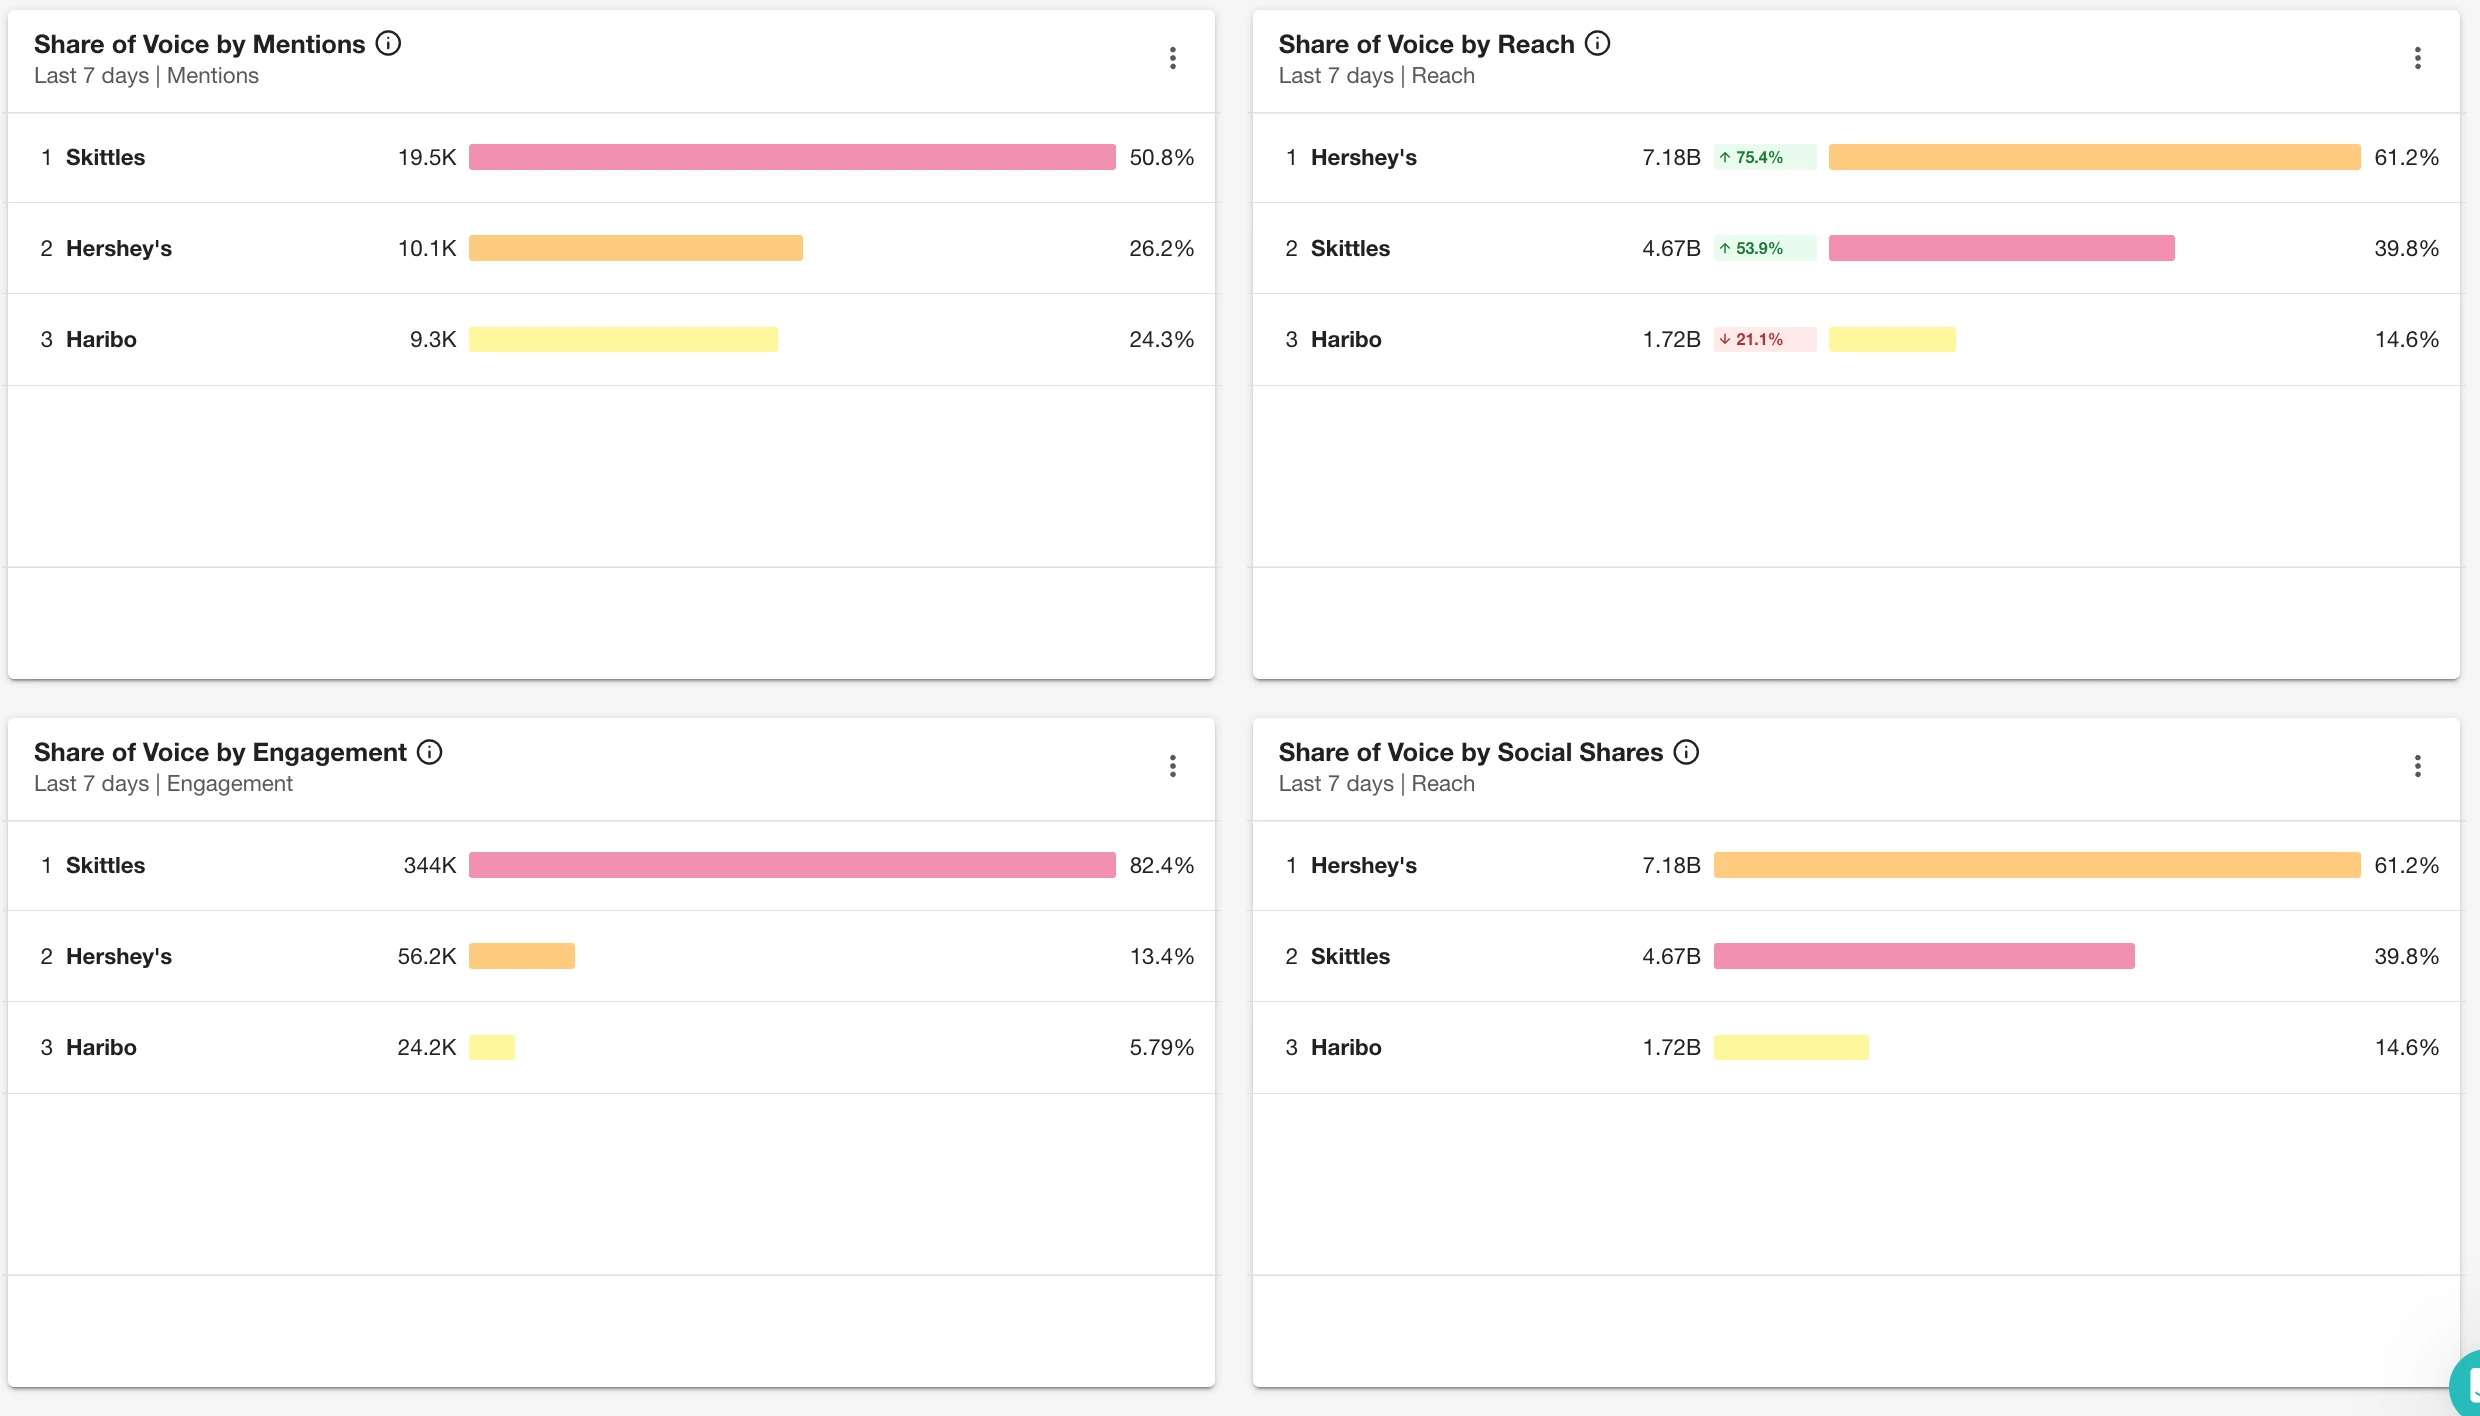
Mentions Over Time and Share of Voice 🗣️
-
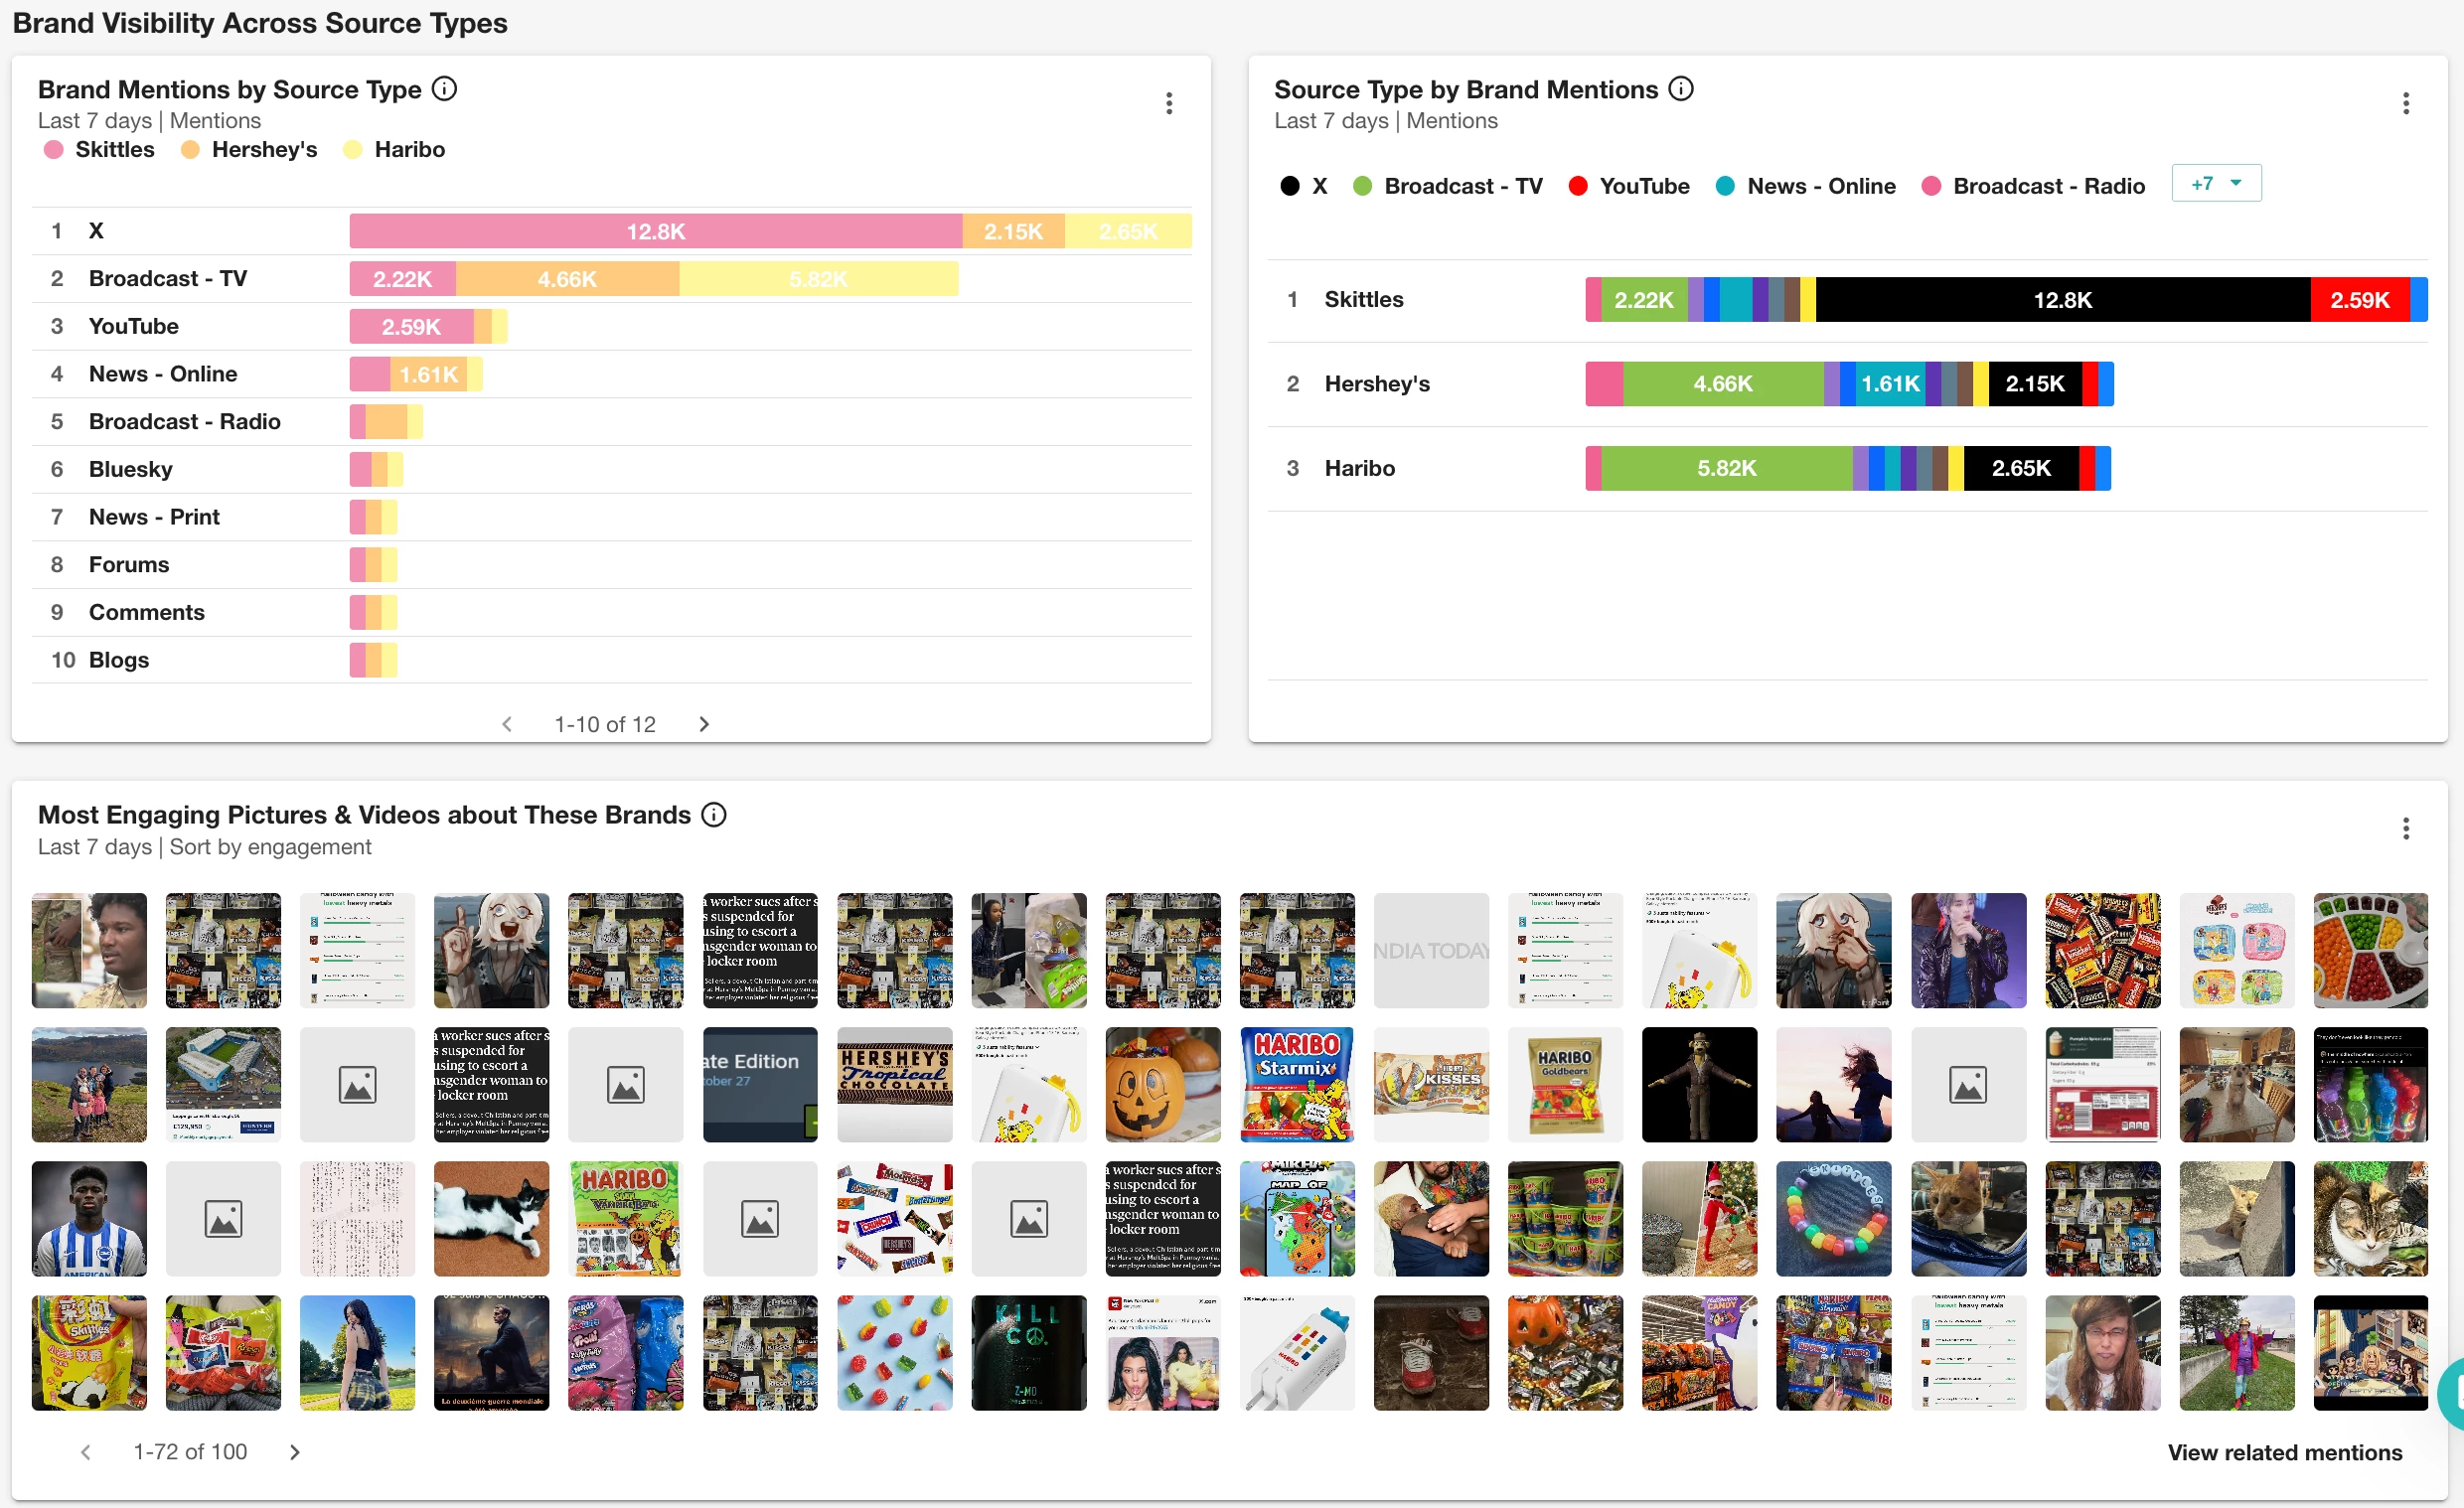
Brand Visibility across editorial and social 📣
-
Sentiment Overview (Sweet or sour?) 🍬😱
-
Most Engaging Photos & Videos
No tricks — just a treat-filled overview of how each candy brand is performing. Check our full widgets Catalog here.
Step 4: Customize Your View
Click Edit to tailor your dashboard. Add or remove widgets, rearrange sections, or adjust filters (like date, region, or media type).

💡 Pro Tip: Any filters or changes you make in Edit mode stay saved — so your view stays perfectly spooky each time you open it.
🧙♀️ Step 5: Share the Magic
Click View to exit Edit mode, then hit Share to send a live link, or export your candy comp as a PDF or slide deck.
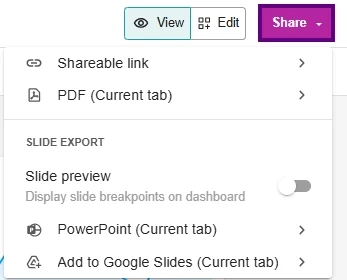
Now you’ve got a snack-sized report your exec team or stakeholders will eat right up.
Bonus: What You Can Do Next
This setup works beyond candy brands — try it for:
-
Campaign benchmarking (pre/post launch)
-
Competitor share-of-voice over Q4
-
Product sentiment across markets
Want more hands-on help?
- Check out the Getting Started with Unified Dashboards in Analyze guide
- Join a live Product Hour (2x/month) or drop into weekly Office Hours — both available on our Training Calendar