


How to Add AI Insights to Your Dashboard (In Seconds)
You’ve built a dashboard… but now you’re staring at charts thinking:
“Okay, but what does this actually mean?”
This is where AI Insights come in.
By the end of this, you’ll be able to turn any widget into a clear, written takeaway—no manual analysis needed.
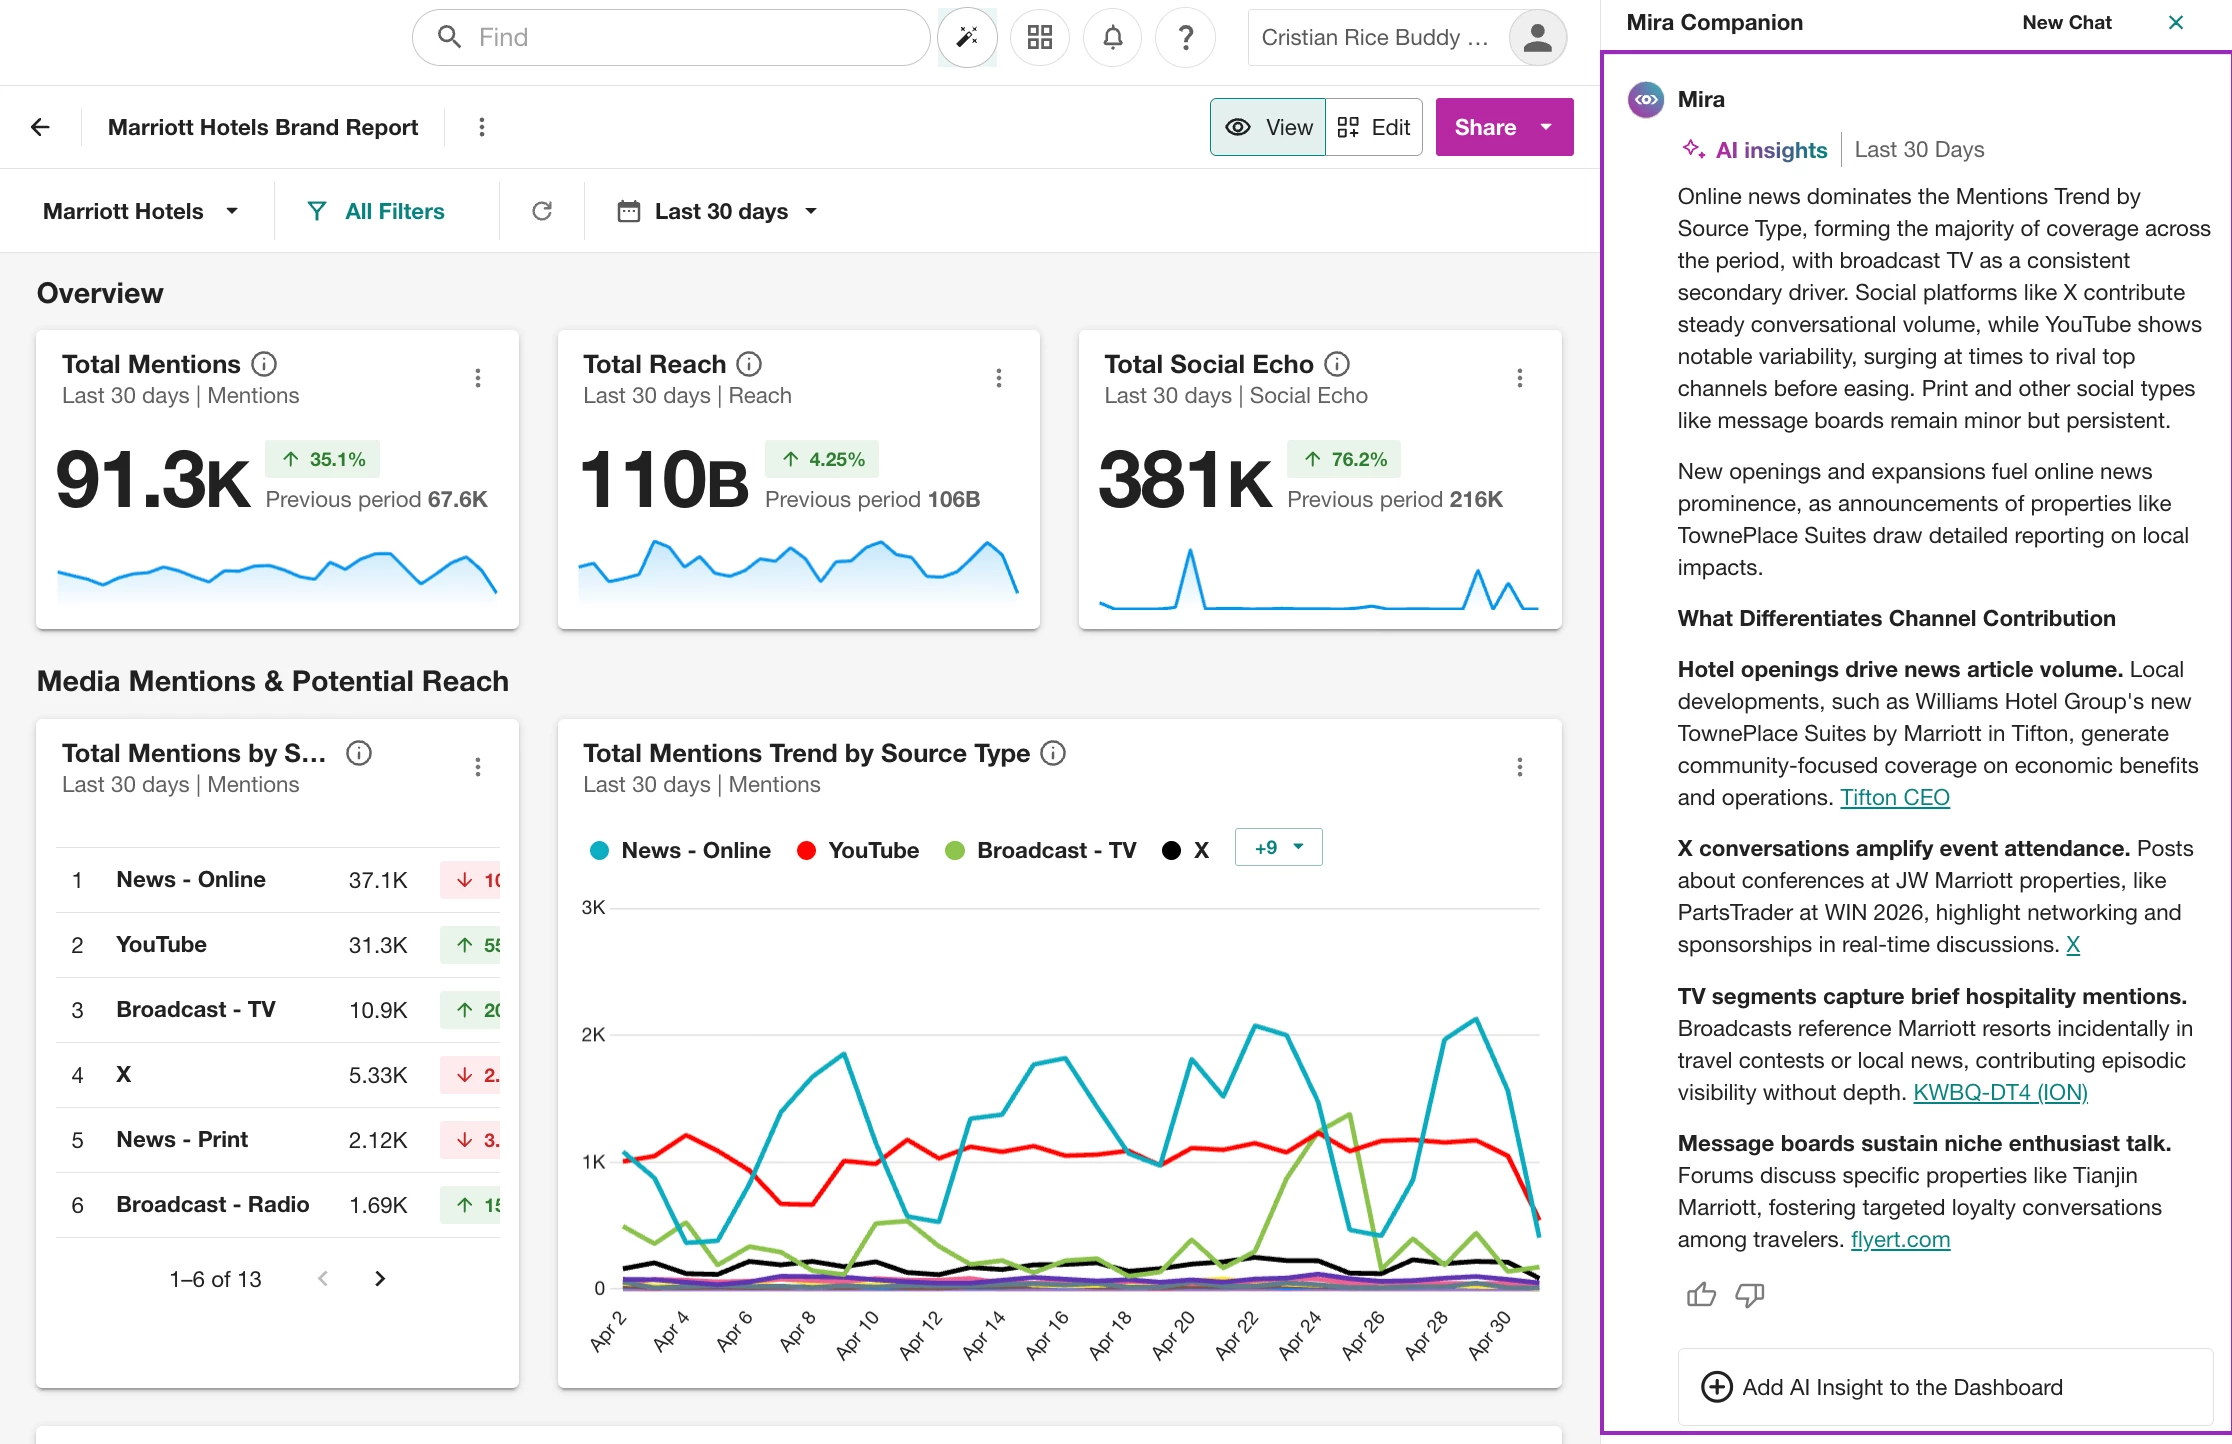
Step 1: Start with a Dashboard Widget
Go to your Analyze, open or create any dashboard, hover your mouse over a widget you want to understand better (for example: Total Mentions by Source Type or a trend chart).
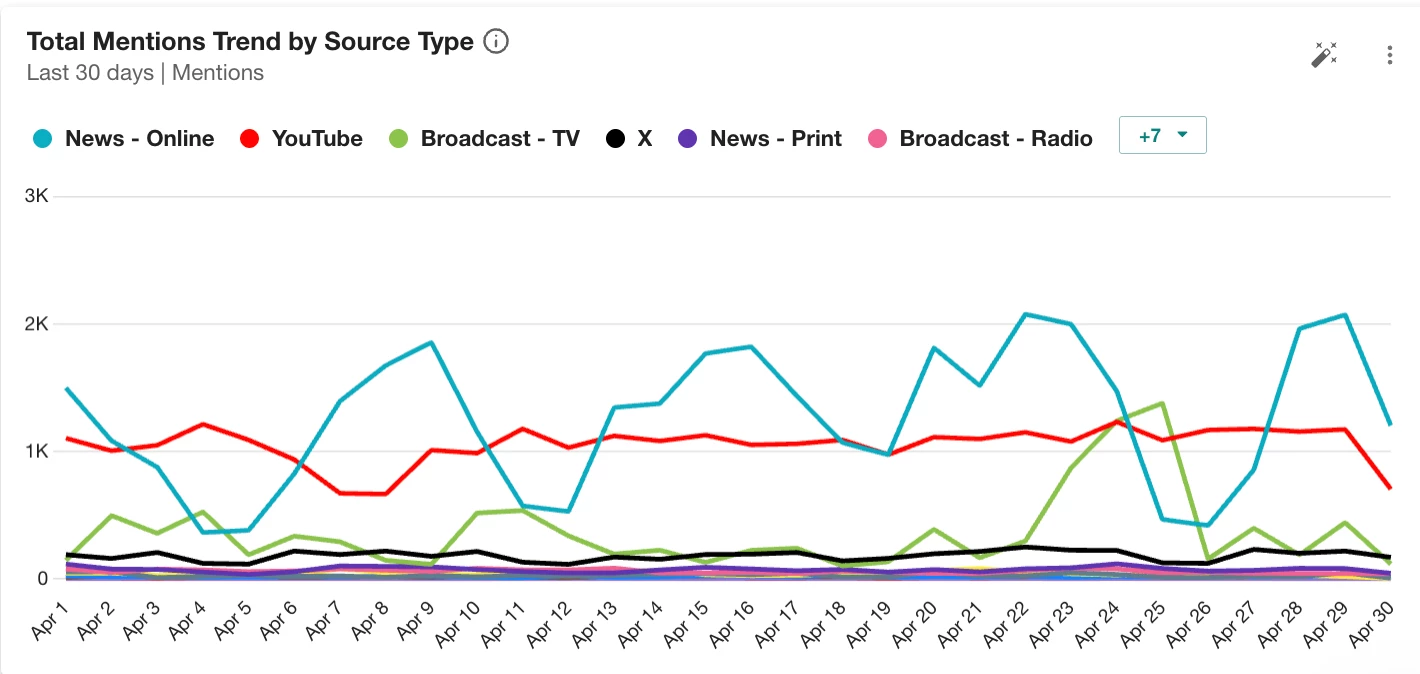
This works on most visual widgets—anything showing volume, trends, or breakdowns.
Step 2: Click the AI Insight Wand ✨
In the top right corner of the widget, hover your mouse and click the wand icon (Generate widget insight).
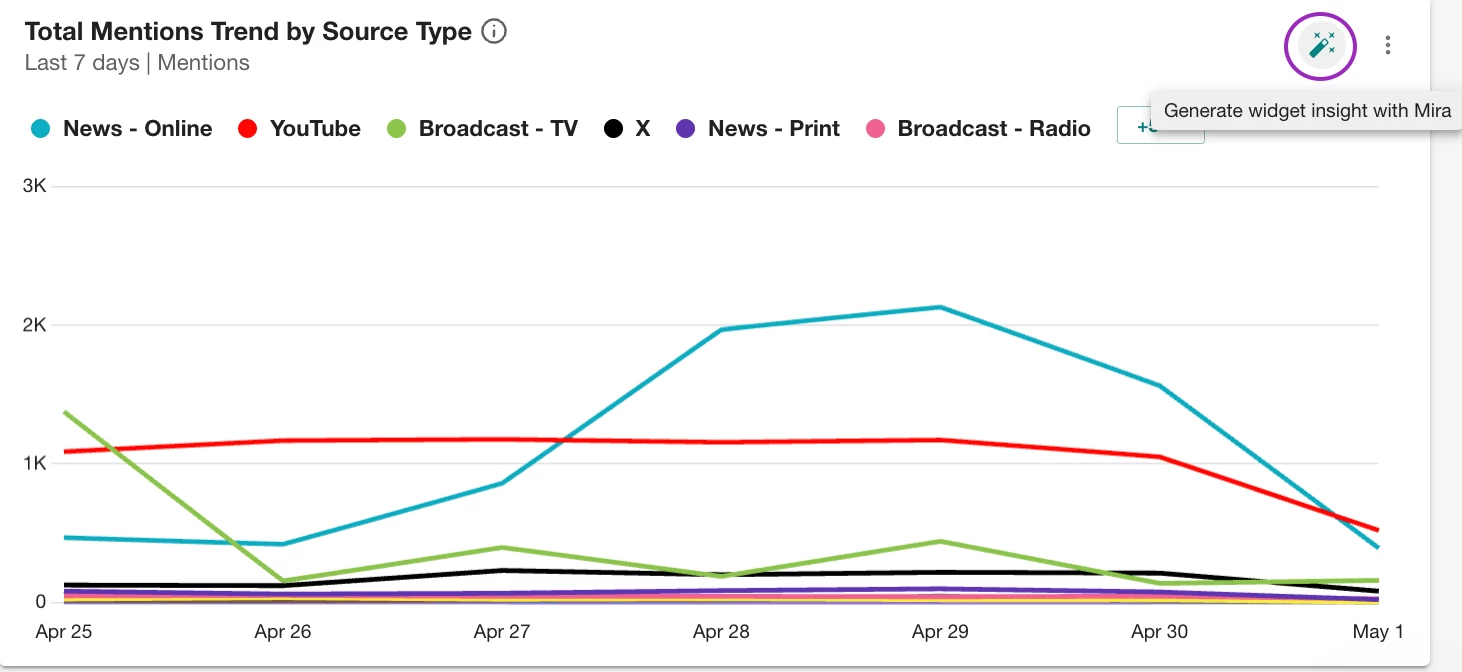
This tells Meltwater:
👉 “Explain what’s happening in this data.”
Step 3: Let AI Do the Work
On the right-hand side, you’ll see Mira generating the insight in real time:
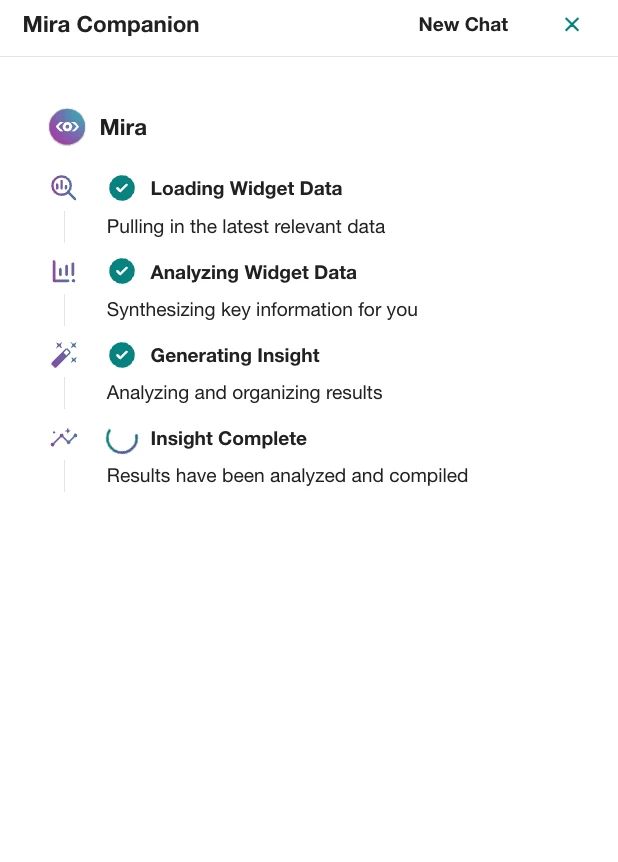
- Loading widget data
- Analyzing patterns
- Generating insight
- ✅ Insight complete
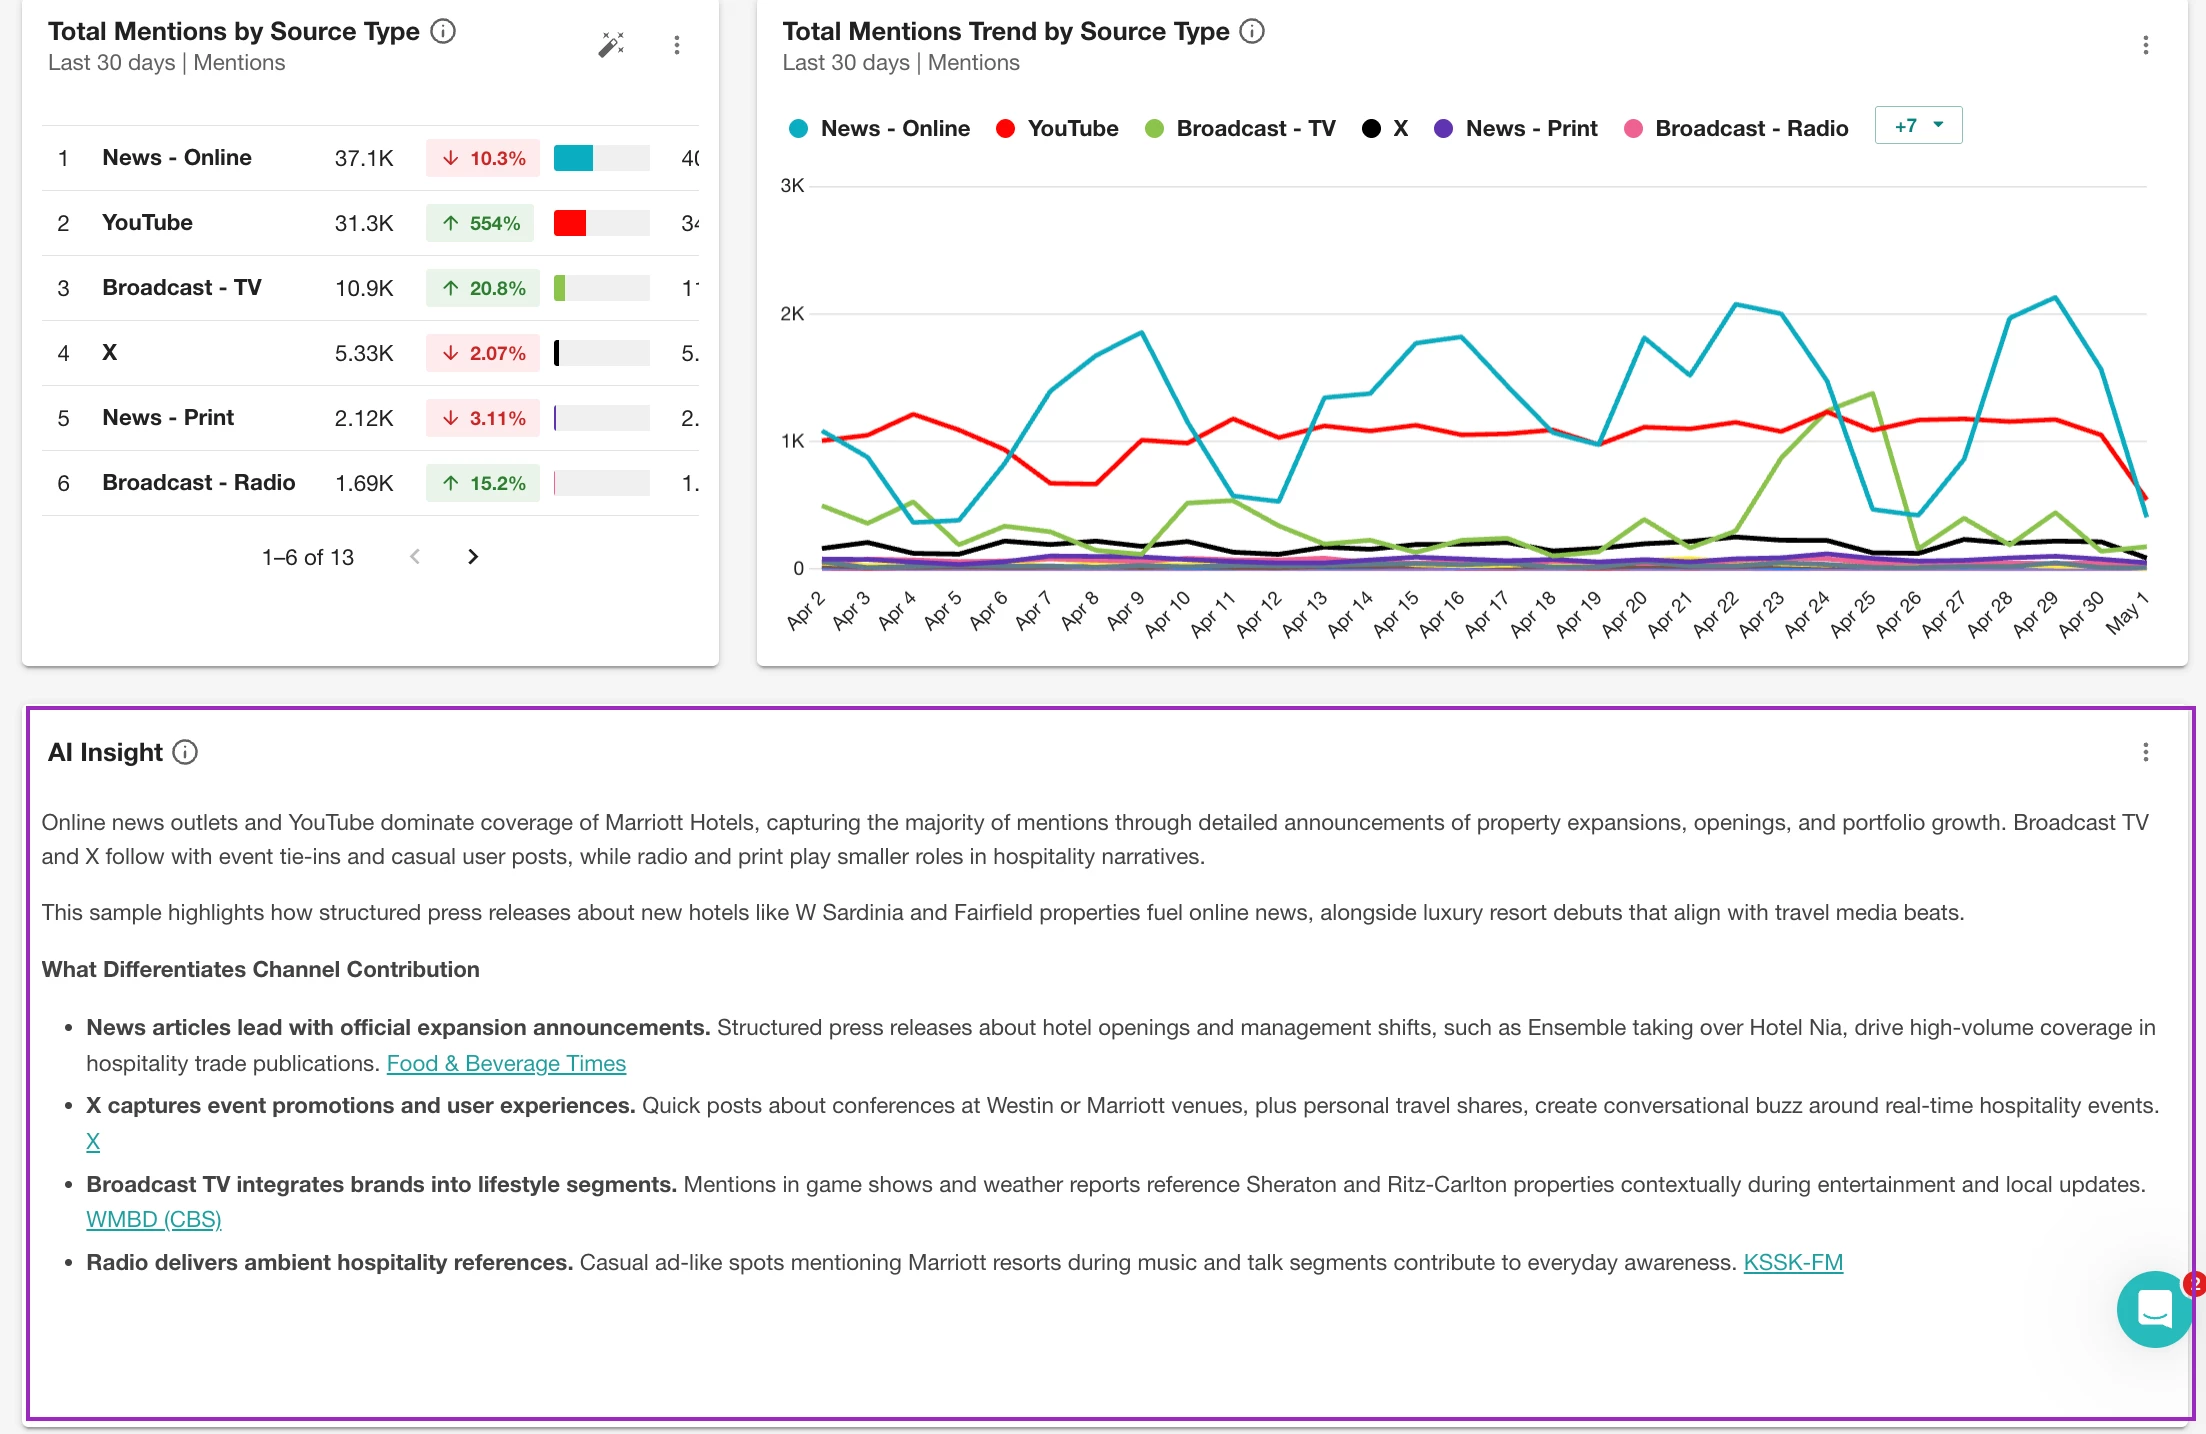
In seconds, you’ll get a written summary explaining:
- what’s trending
- what’s driving spikes
- how different sources or channels compare
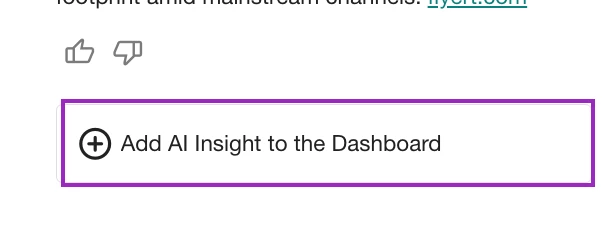
Step 4: Add the Insight to Your Dashboard
Once the insight is generated, click:
👉 Add AI Insight to Dashboard
Now your dashboard doesn’t just show charts—it explains them.
Why This Matters
Most dashboards show what is happening. This helps you explain why it’s happening.
Instead of manually digging through data, you can:
- instantly understand spikes and changes
- add context for stakeholders
- turn dashboards into ready-to-share reports
What’s the first widget you’d want AI to explain for you?