The Analytics section in Explore+ lets you dive deeper into your media searches by visualizing and comparing results across different topics, brands, or campaigns.
Note: To use Explore+ Analytics, you must be a Viewer or Admin in Explore+.
With Analytics, you can:
-
View insights from one or multiple searches in a visual format
-
Filter and explore key trends and metrics, such as volume over time, sentiment, top sources, and more
-
Compare up to 60 Optimized searches and 10 Standard searches at the same time
Whether you're monitoring brand reputation, tracking a crisis, or analyzing a campaign, Analytics gives you a high-level overview to help you make informed, data-driven decisions.
Setting Up Your Analytics View
To set up your Analytics tab, follow these steps:
- Click the Explore+ drop-down in the left-hand navigation bar
- Select Analytics
- Click the Select Search drop-down in the top left-hand corner
- Select from Optimized or Standard searches
Note: If you selected multiple searches, select between At least one or All of these.
- At least one: populate results that match any of the selected searches - giving you a broader view.
- All of these: populate results that match every selected search - narrowing in on intersecting themes.
- Click Apply
- Adjust the date range in the top right-hand corner as needed
- To add a filter, select Add filter in the top left-hand corner
- Select your filter(s)
- Click Ok
Interpreting Your Analytics
Once your data has loaded, you will see analytics cards on your screen. To view and interpret the results powering this data, follow these steps:
- Click Show Content in the top right-hand corner. A slide-out will appear on the right-hand side showcasing the Content Stream
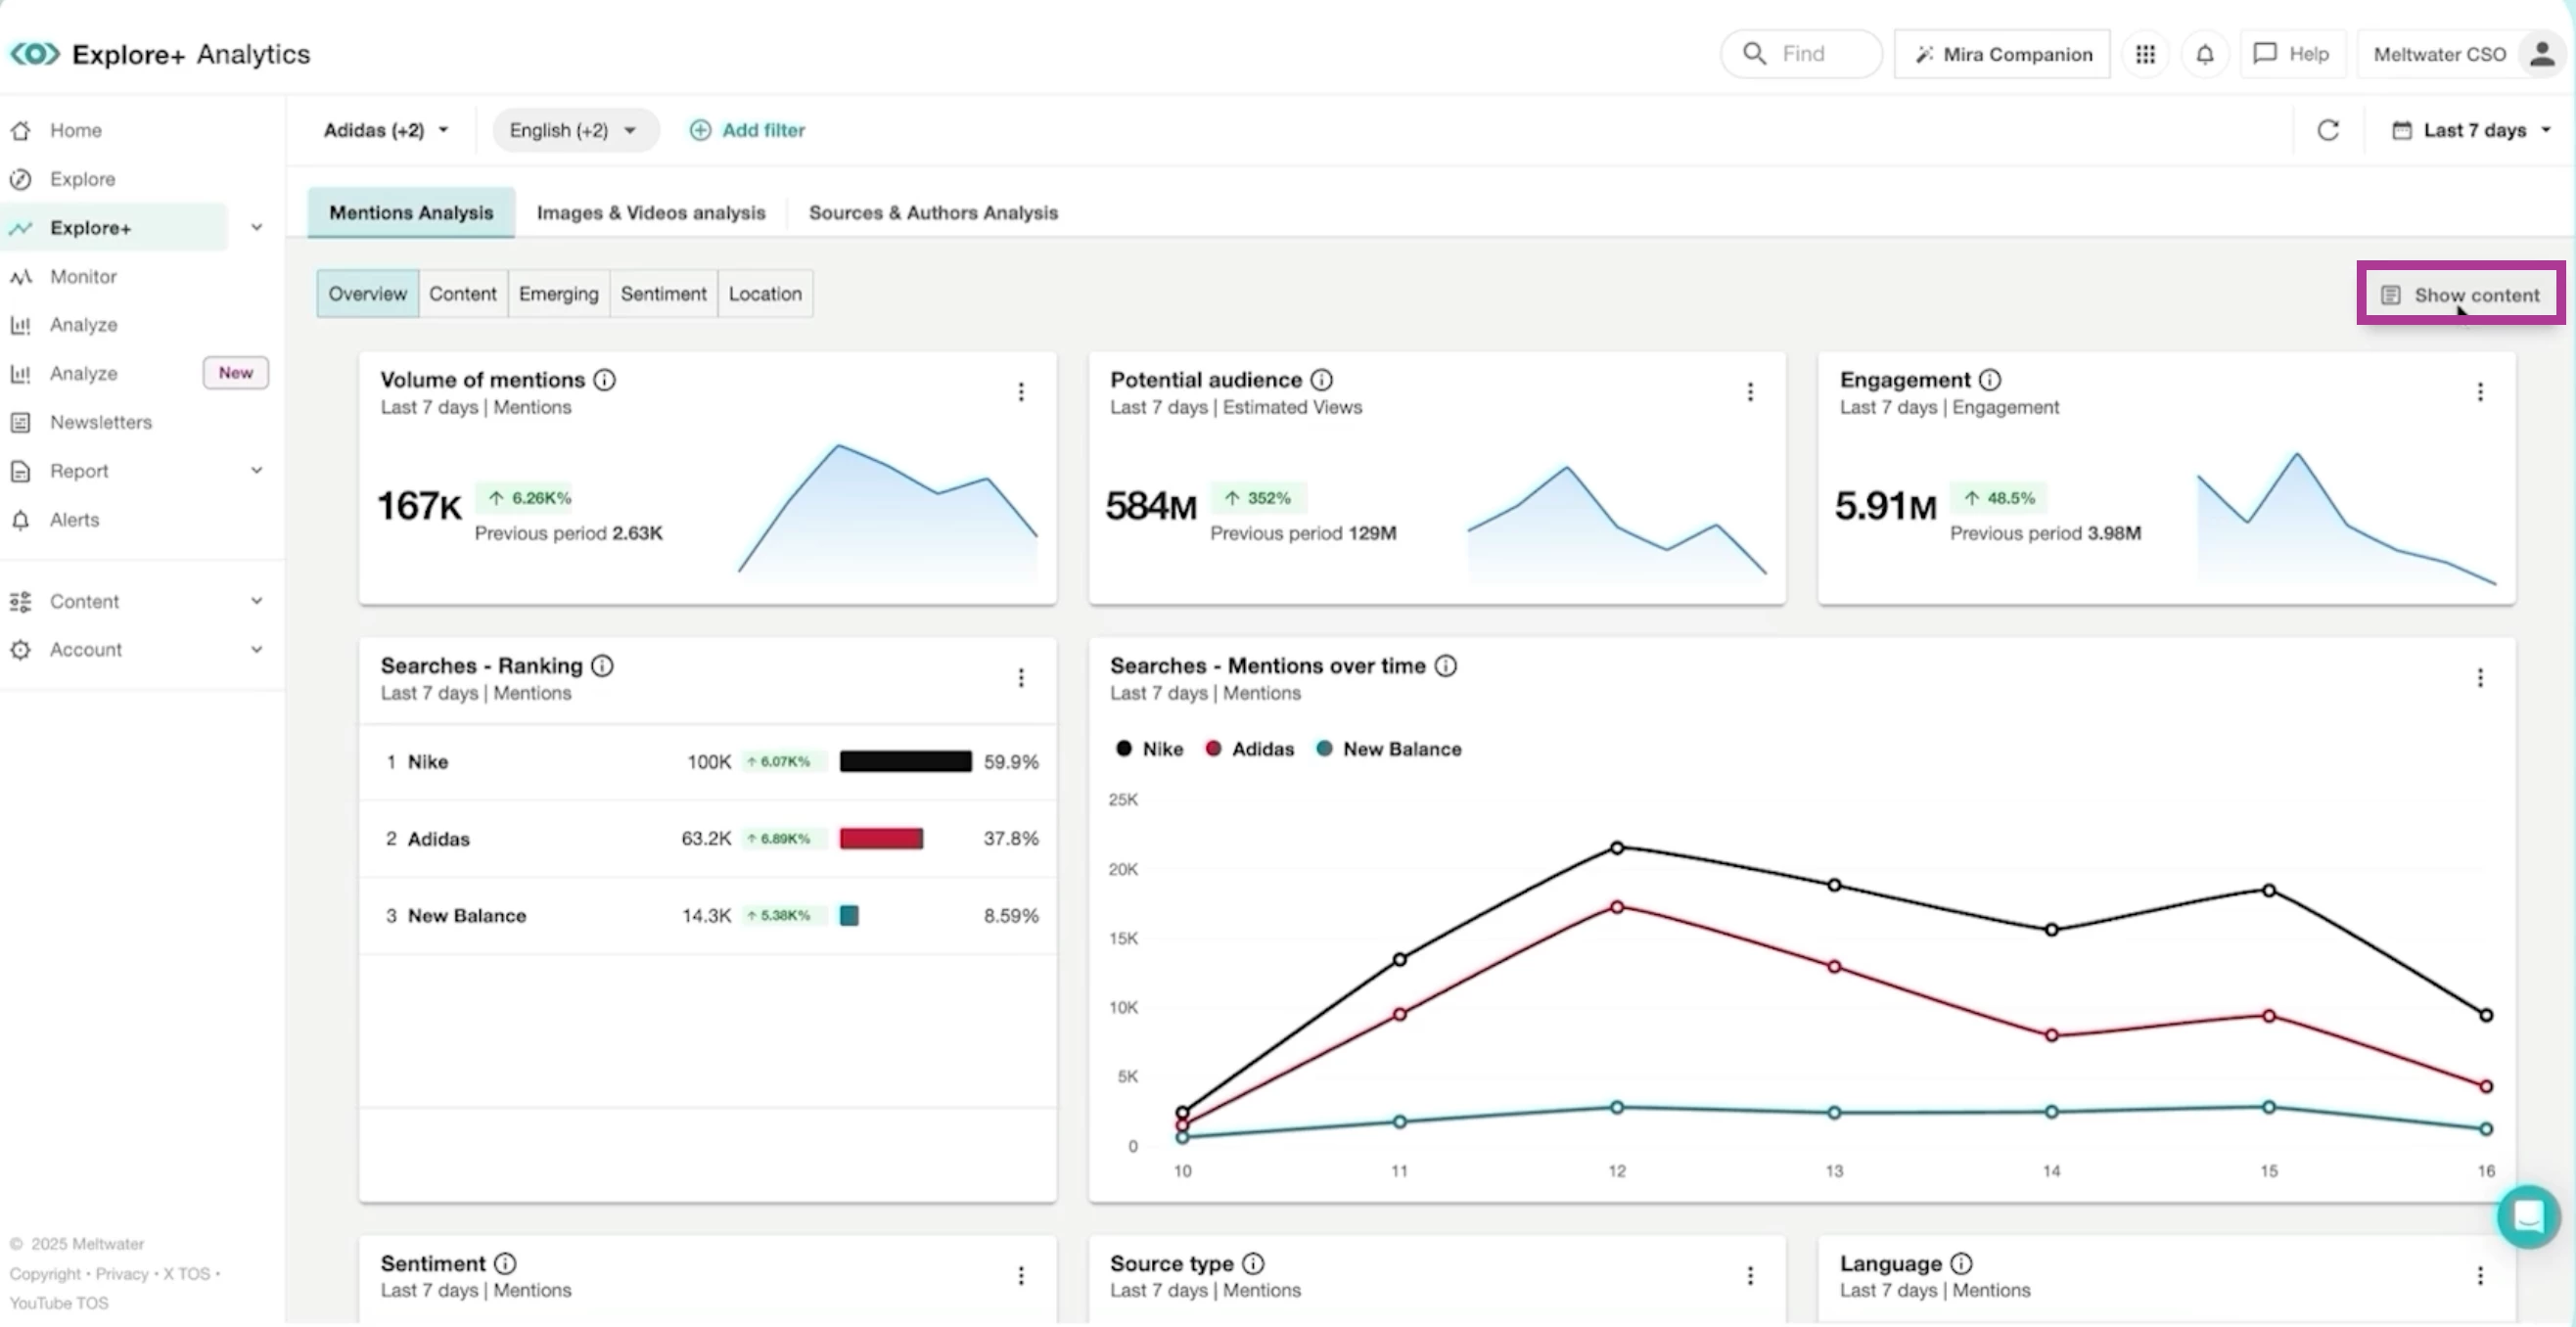
- Navigate to the top toolbar and select between
- Mentions Analysis: Understand what is being said and how people feel about it. Subtabs include:
- Overview: Key metrics like volume over time
- Content: Top articles and social posts
- Emerging: New themes or trending topics
- Sentiment: Positive, neutral, and negative sentiment breakdown
- Location: Geographic distribution of mentions
- Images & Video Analysis: Visual trends or creative assets. Subtabs include:
- Overview
- YouTube
- Sources & Authors Analysis: Who is driving the conversations and which sources matter most. Subtabs include:
- Analytics: X Author demographics, bio keywords, and ranking by language
- Source List: Media outlets and social platforms
- Author List: Active and influential users
- Mentions Analysis: Understand what is being said and how people feel about it. Subtabs include:
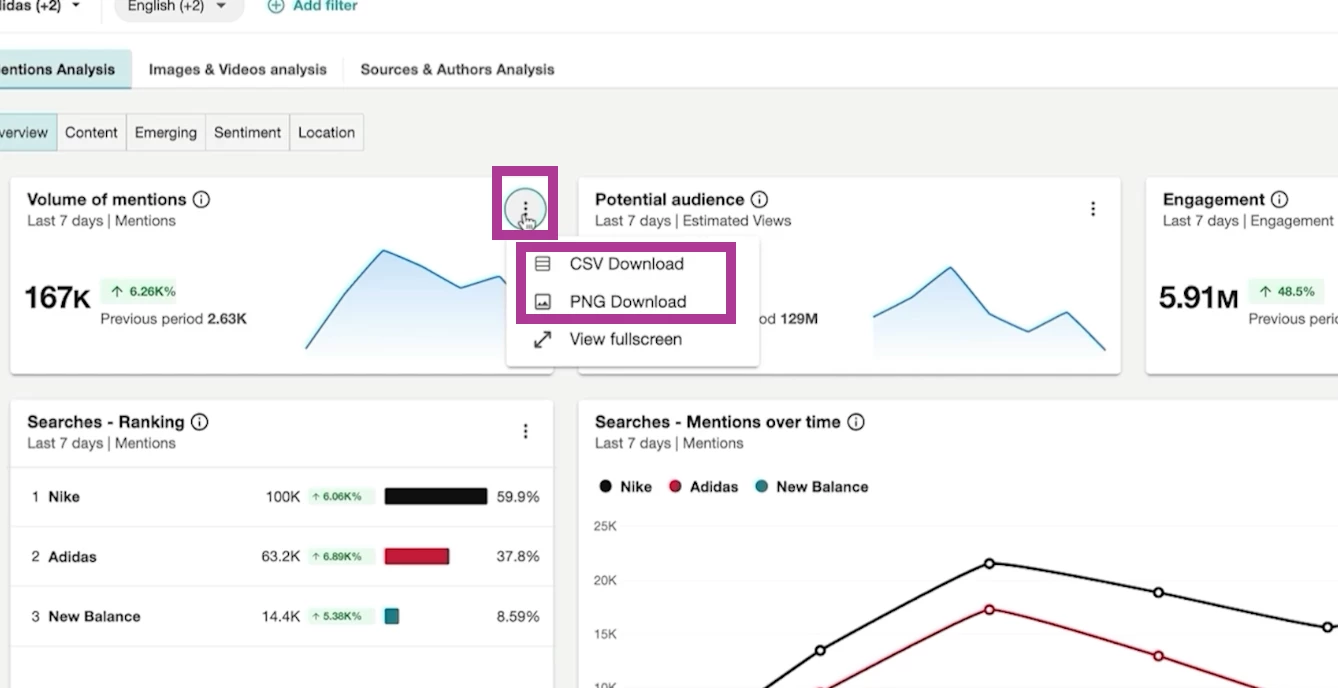
- To export any insight, select the kebab menu in the top right-hand corner of any widget. Choose between:
- CSV Download
- PNG Download