

🇦🇺 Australia: Isentia to Meltwater Migration Guide

You're moving from Isentia to a platform that captures a broader audience picture and gives you more flexibility in how you report on it. This guide covers the key differences you'll notice in your data and how to set yourself up for clean reporting from day one.
In this article you’ll find:
Reach and AVE: Why Your Numbers Will Change
When you start pulling reports in Meltwater, your Reach and AVE numbers will likely be higher than what you saw in Isentia — even if your actual coverage volume hasn't changed. Here's why.
Reach
Two differences drive the change:
- Measurement window: Isentia calculates reach using weekly website visitors. Meltwater uses monthly unique visitors, which captures a larger audience over time.
- Traffic sources: Isentia does not include mobile traffic. Meltwater includes both desktop and mobile, reflecting how audiences actually consume media today.
Both of these factors push Meltwater's reach numbers higher than Isentia's for the same coverage.
👉For a full breakdown of how Meltwater calculates reach, see How Meltwater Calculates Reach.
AVE (Advertising Value Equivalency)
- AVE is calculated from reach
- Meltwater's reach numbers are higher (monthly + mobile vs. weekly + desktop only), your AVE will increase proportionally.
👉For a full breakdown of how Meltwater calculates AVE, see How Meltwater Calculates AVE.
What this means:
Higher reach and AVE in Meltwater doesn't mean your media performance suddenly improved. It means the platform is measuring a wider audience (monthly instead of weekly, mobile included) than Isentia was capturing.
How to Keep Your Reporting Consistent
You have three options to manage the transition cleanly.
Option 1. Communicate the change to Stakeholders
The simplest approach. Let internal stakeholders know that increases in Reach and AVE are driven by a platform change, not a performance spike. Key points to share:
- Meltwater measures monthly unique visitors; Isentia used weekly — a longer measurement window naturally produces higher numbers
- Meltwater includes mobile audiences; Isentia tracked desktop only
- The AVE formula hasn't changed — the underlying reach data is more comprehensive
- This is a one-time recalibration, not an ongoing trend
Option 2. Adjust your AVE calculation
Meltwater's default AVE formula uses $0.37 USD per estimated viewer. You can adjust this value to bring your Meltwater reports closer to your historical Isentia figures if continuity matters more than accuracy.
To add and configure an AVE widget:
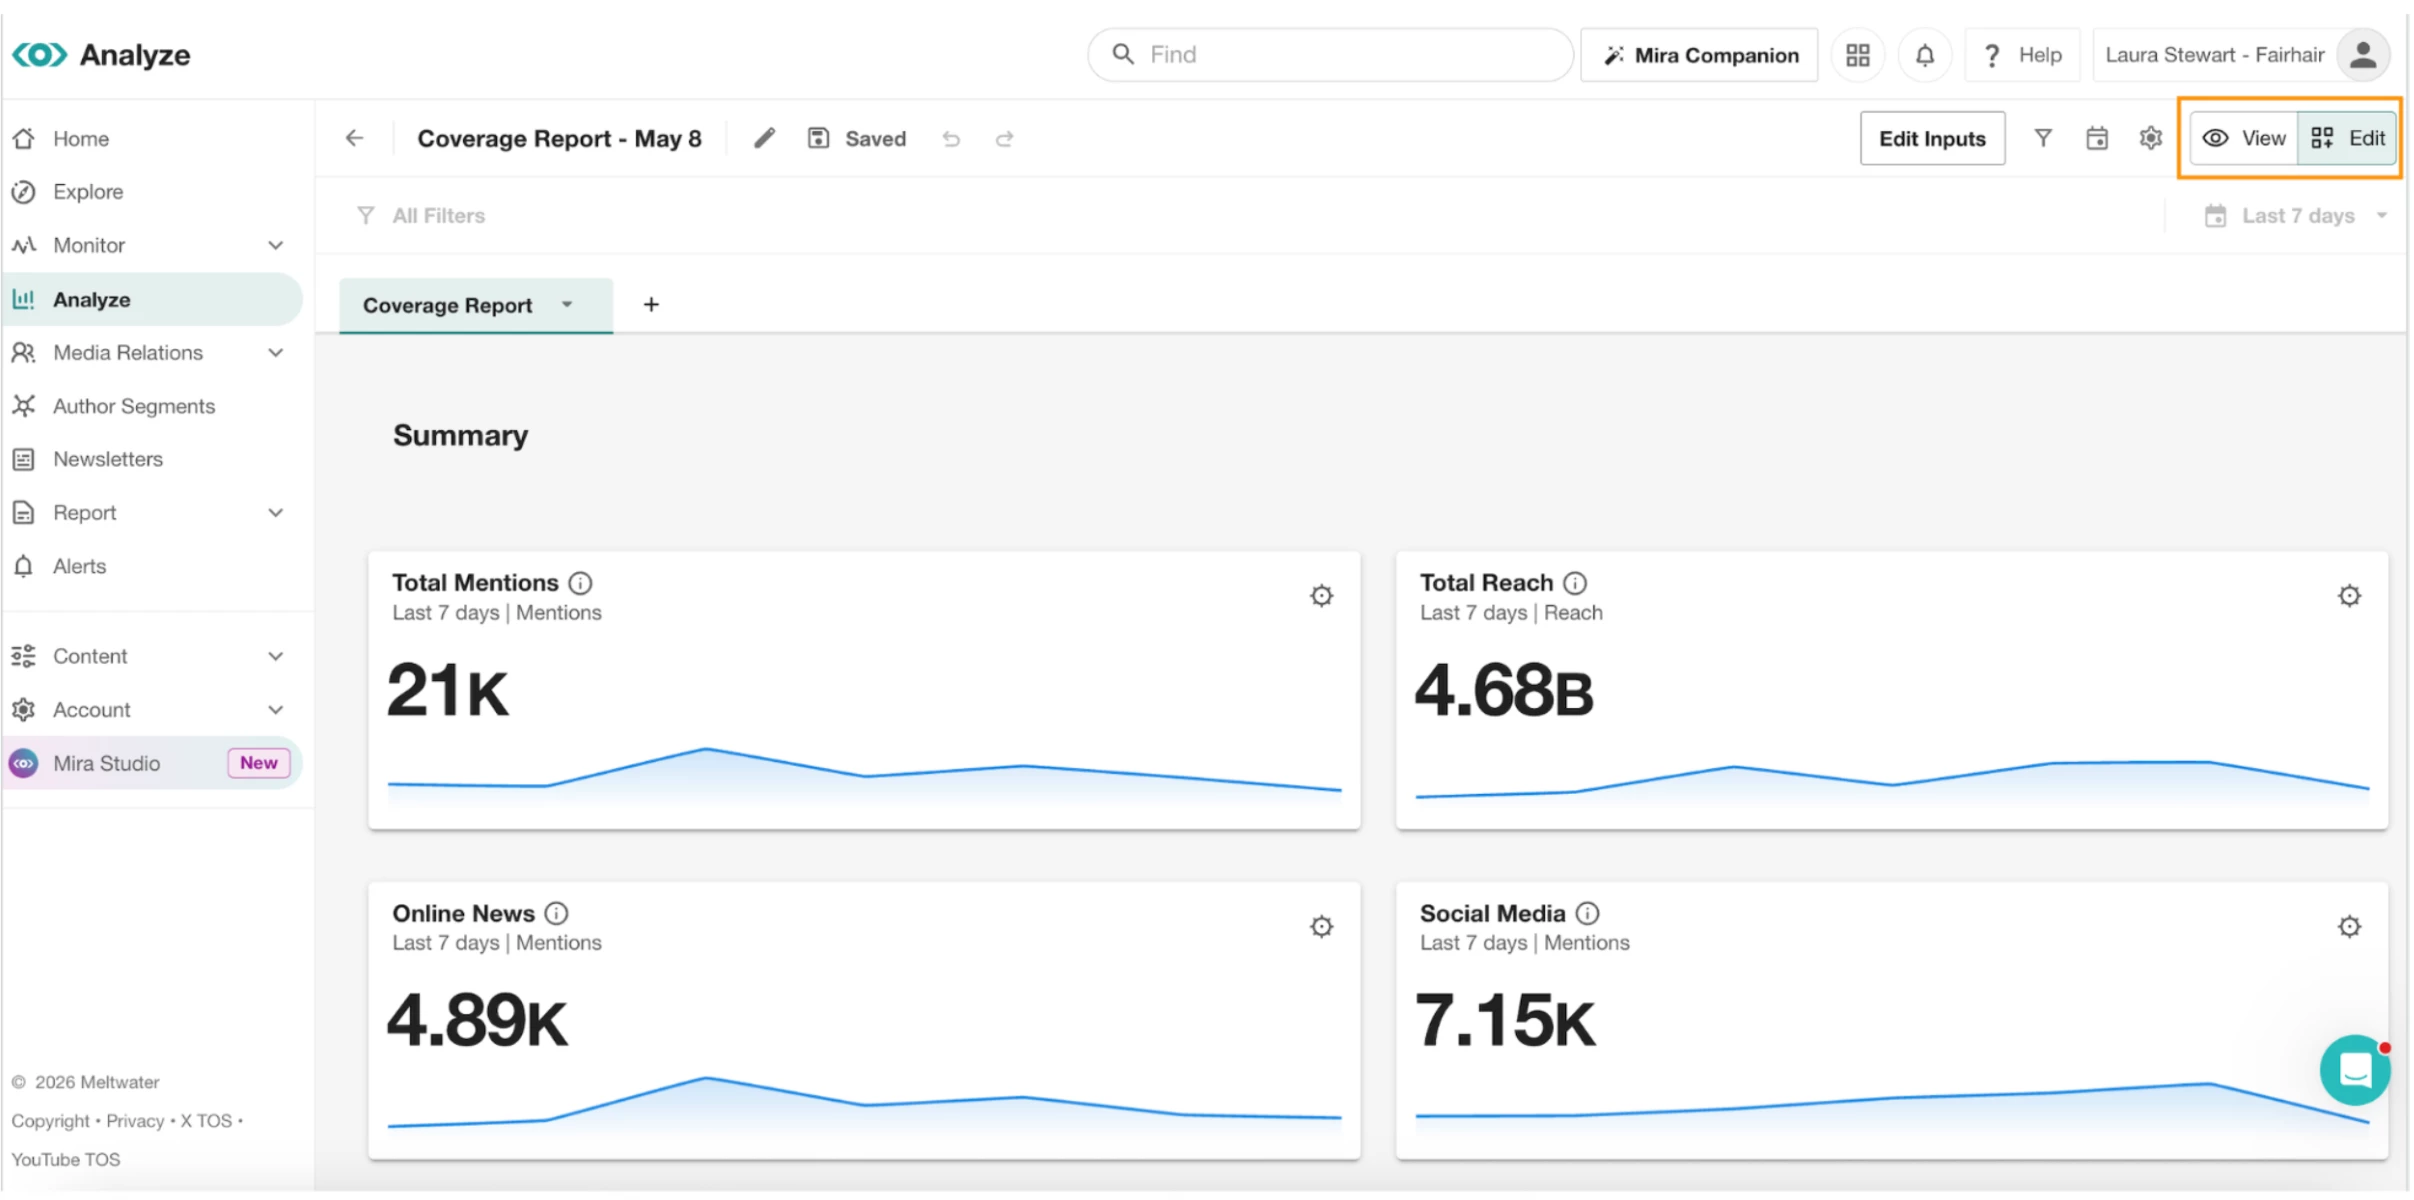
- Open your dashboard in Analyze (or create one using Create a dashboard using this guide)
- Click Edit in the top right corner
- Navigate to an existing row (with one or two widgets)
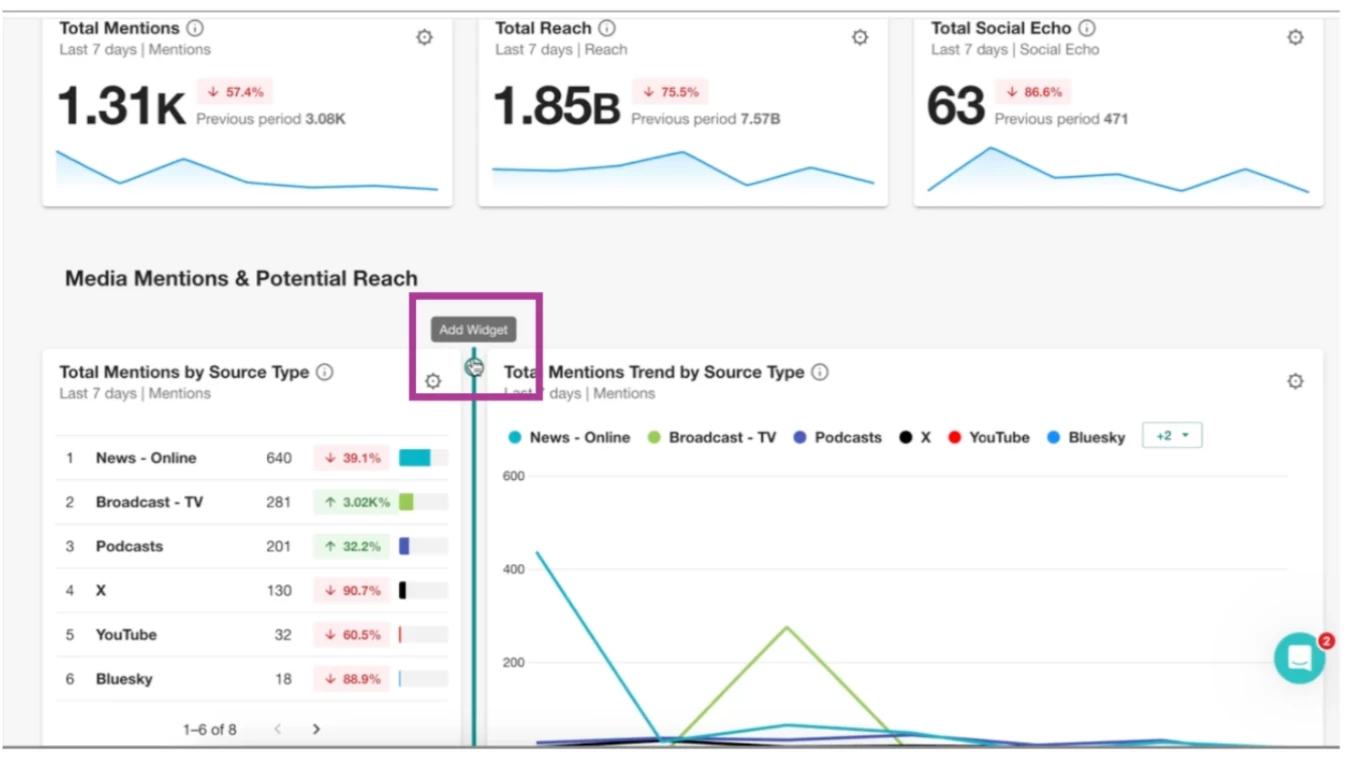
- Click Add Widget
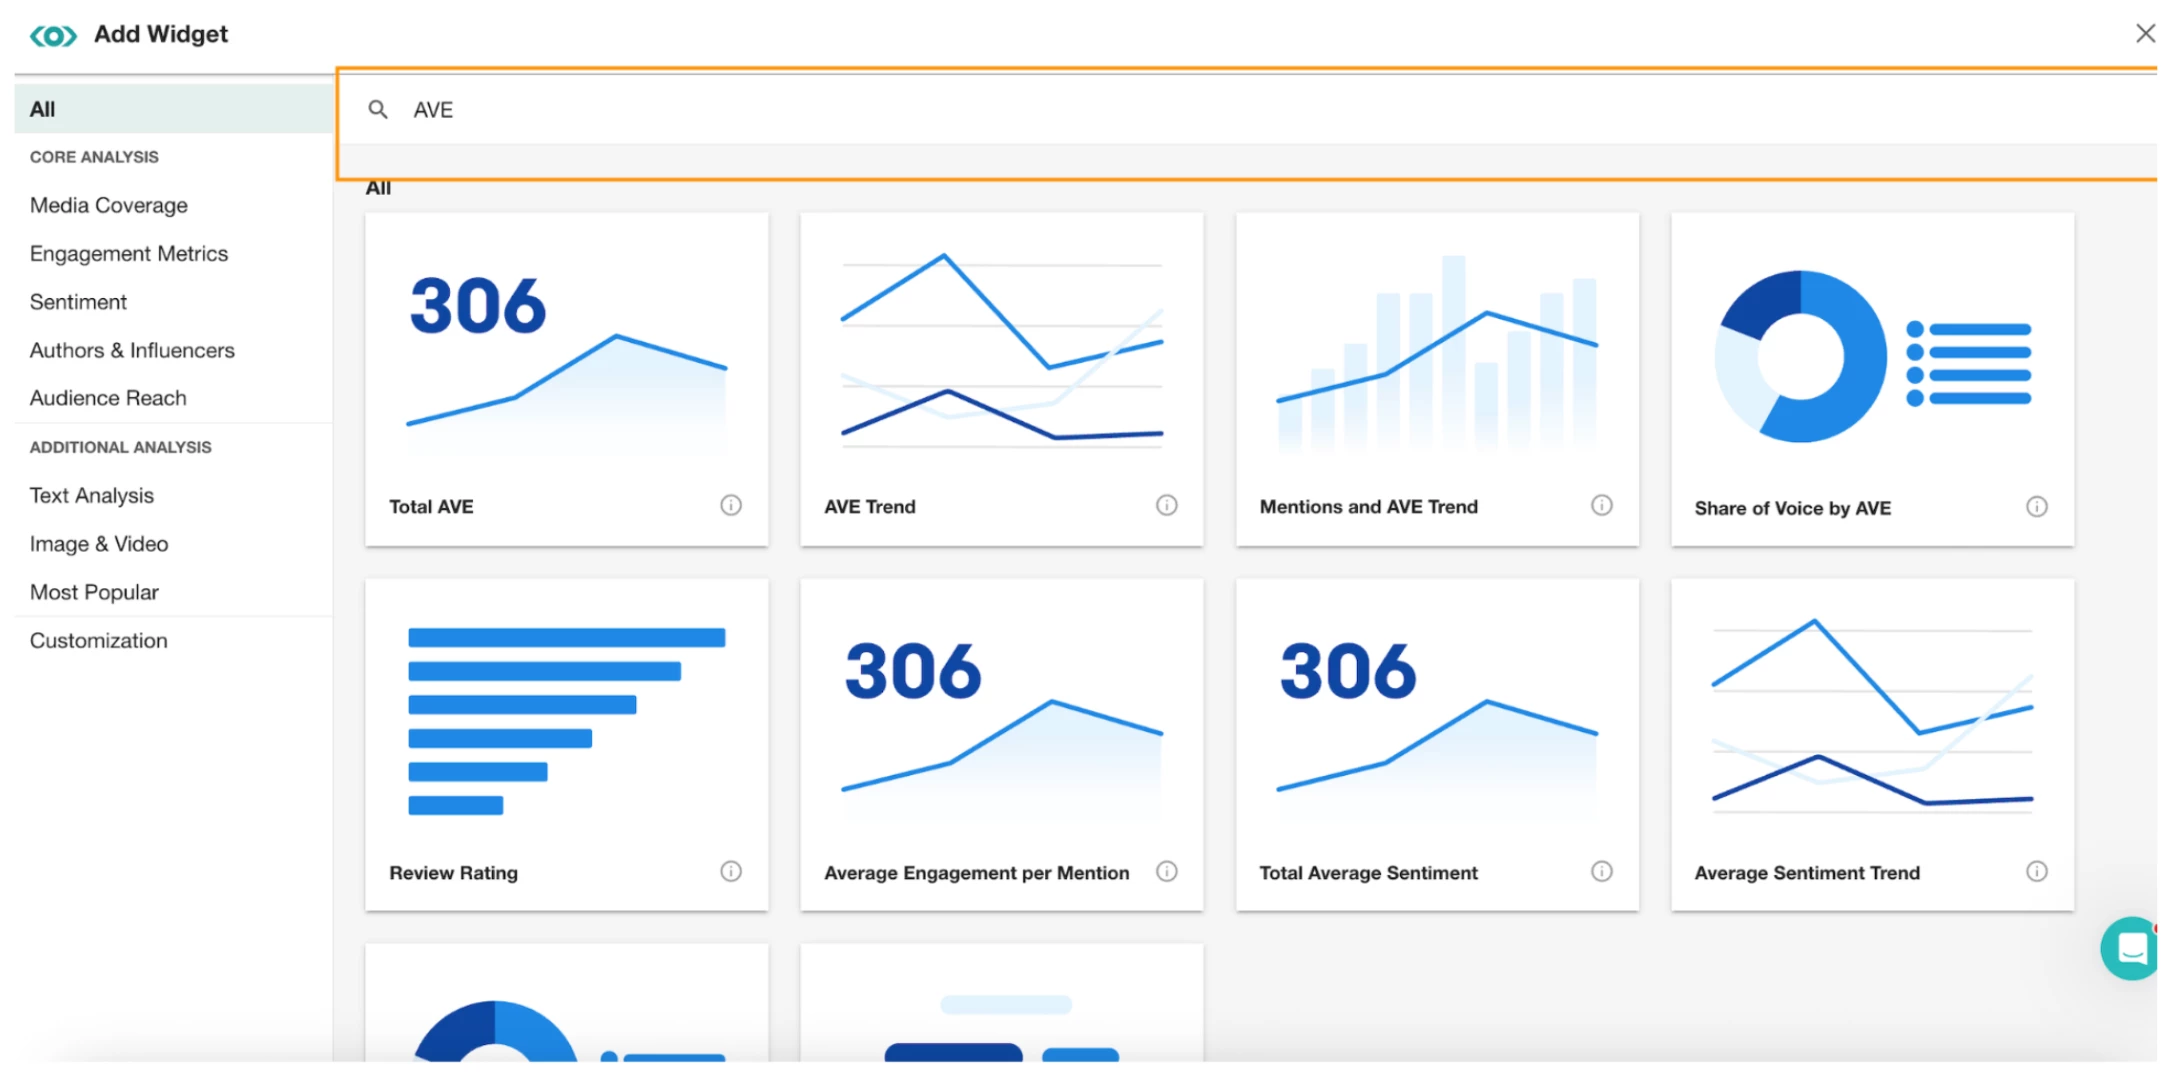
- In the pop-out window, Search for AVE metrics that suit your reporting (you can also search for Reach widgets)
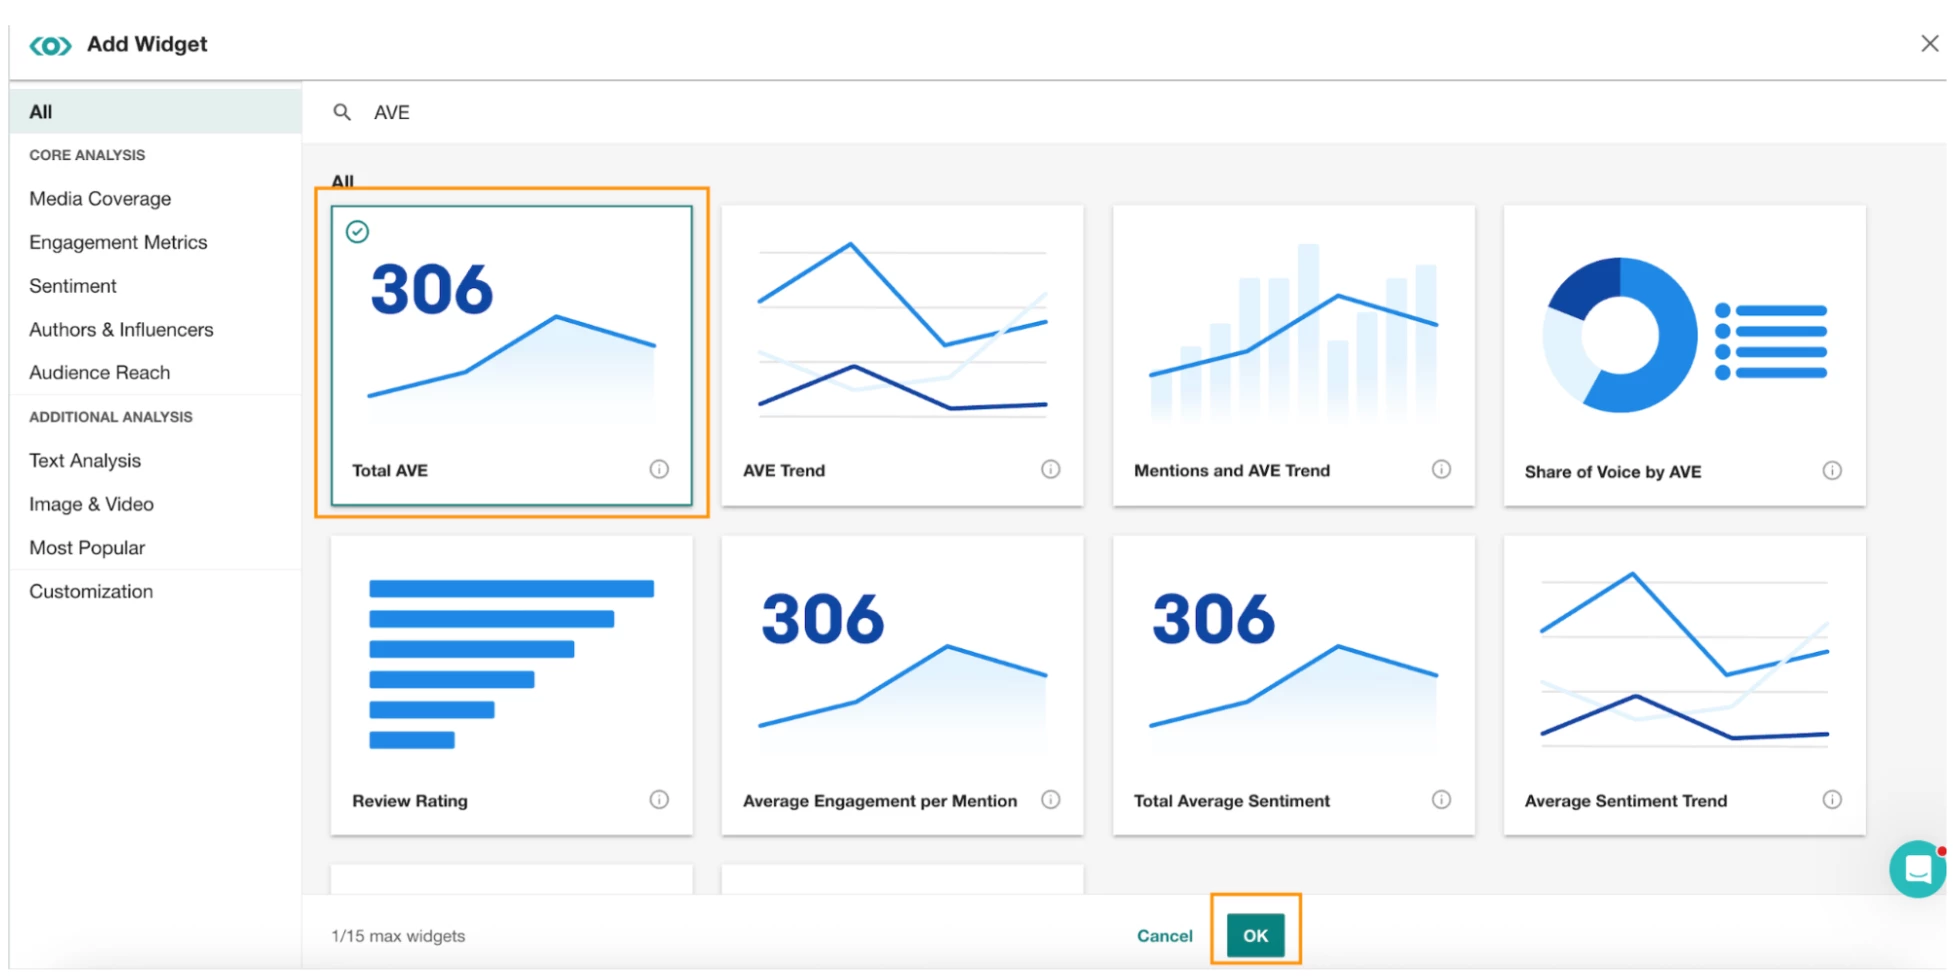
- Select your preferred AVE widget and press OK
- In the configuration window that opens, update the AVE formula and currency to match your needs
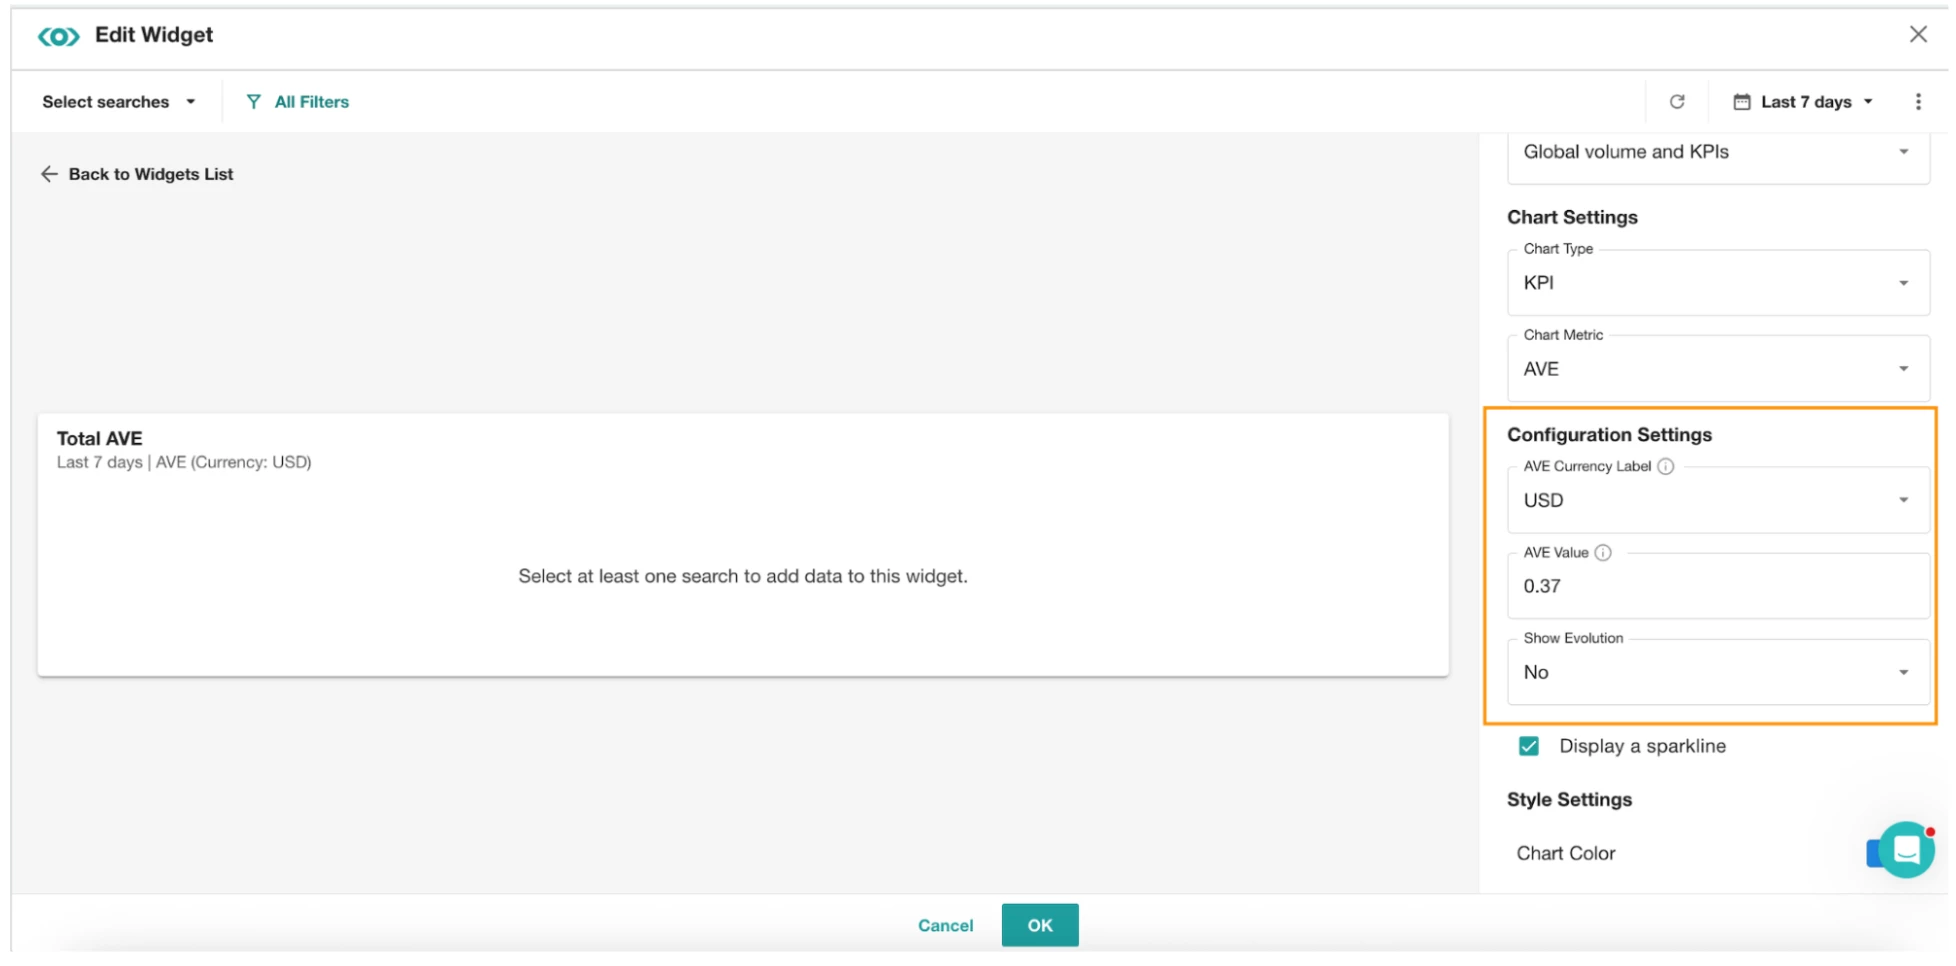
- Press OK to save
Option 3. Create a new reporting benchmark
Use Meltwater's own historical data to set a new baseline. Compare the past 12 months in Meltwater against your Isentia reporting, then use the Meltwater figures as your go-forward benchmark.
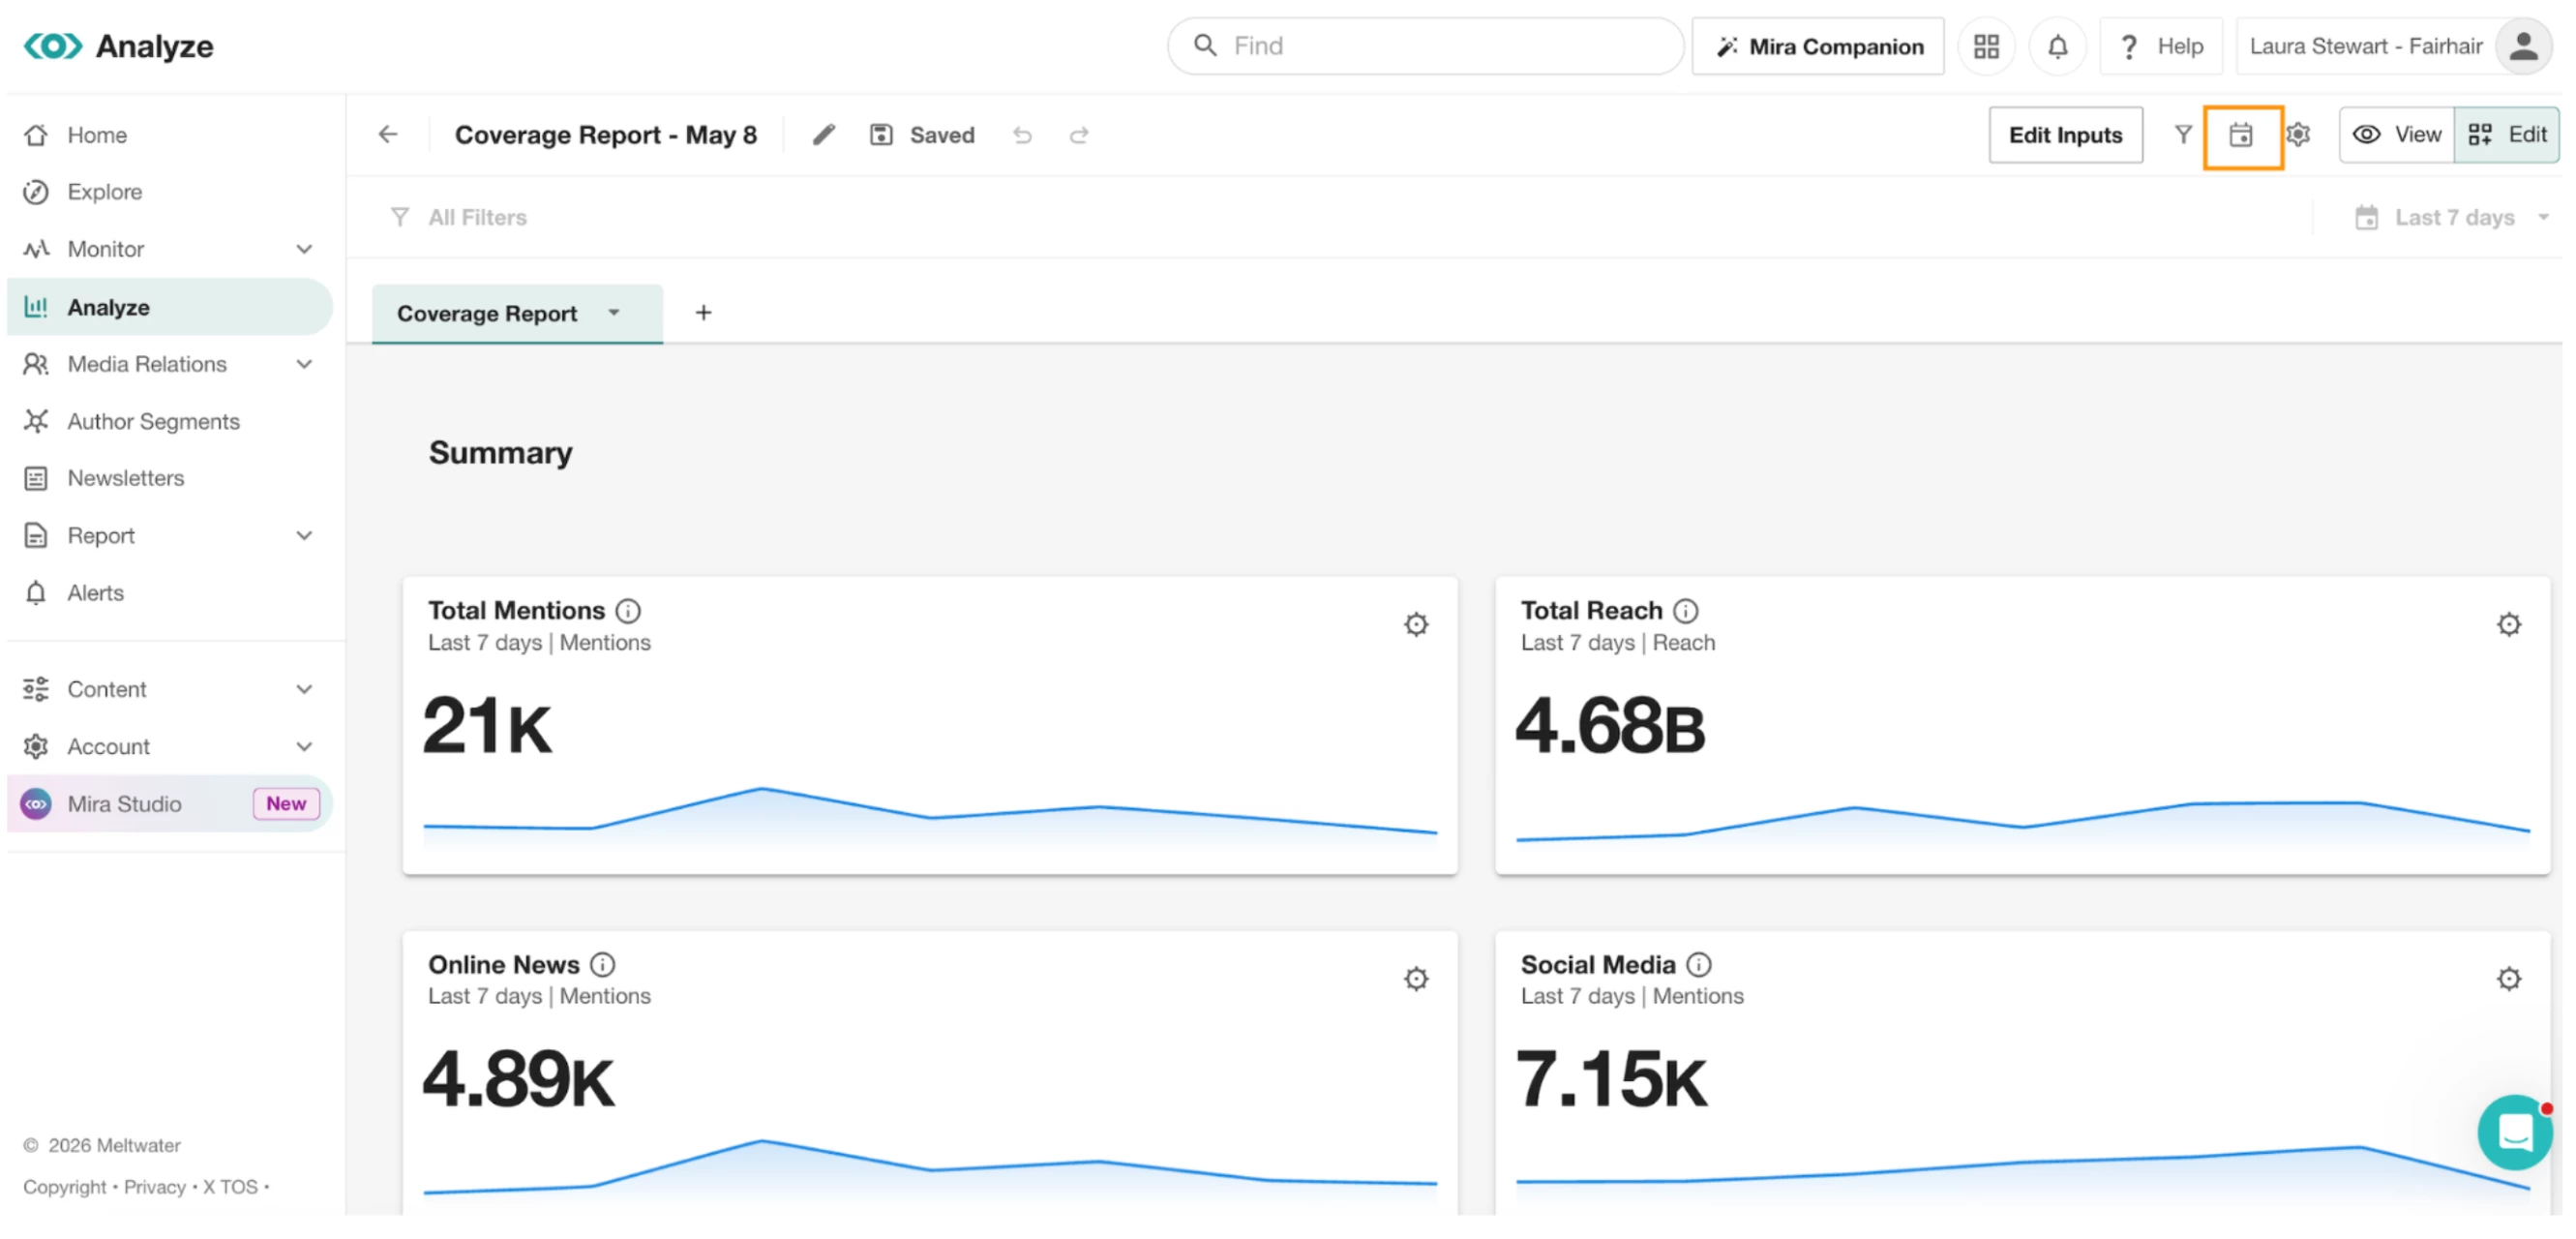
To create a benchmark comparison:
- Open your dashboard in Analyze (make sure you've already added your AVE or Reach widgets using the steps above)
- Click Edit
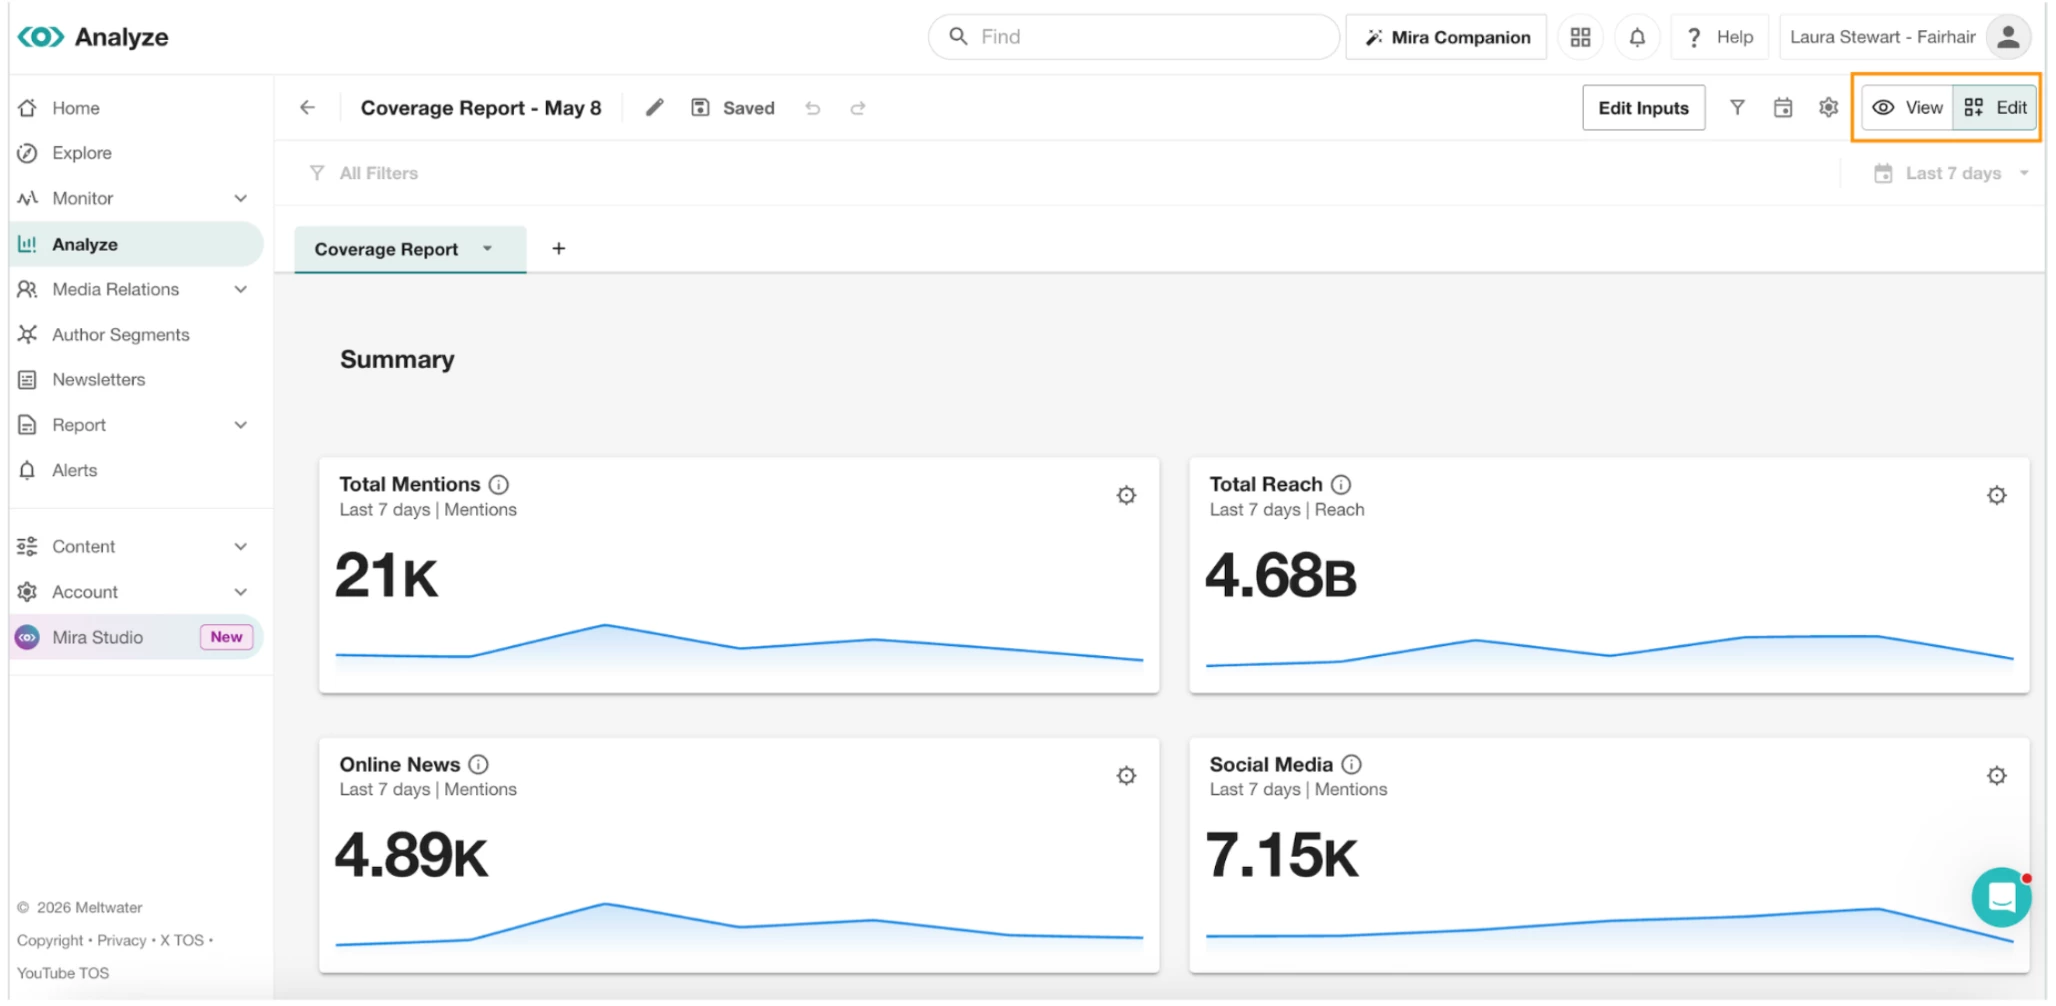
- Click the calendar icon
- Select last year from the pop out window
- Click the drop-down arrow on your dashboard tab.
- Select Duplicate
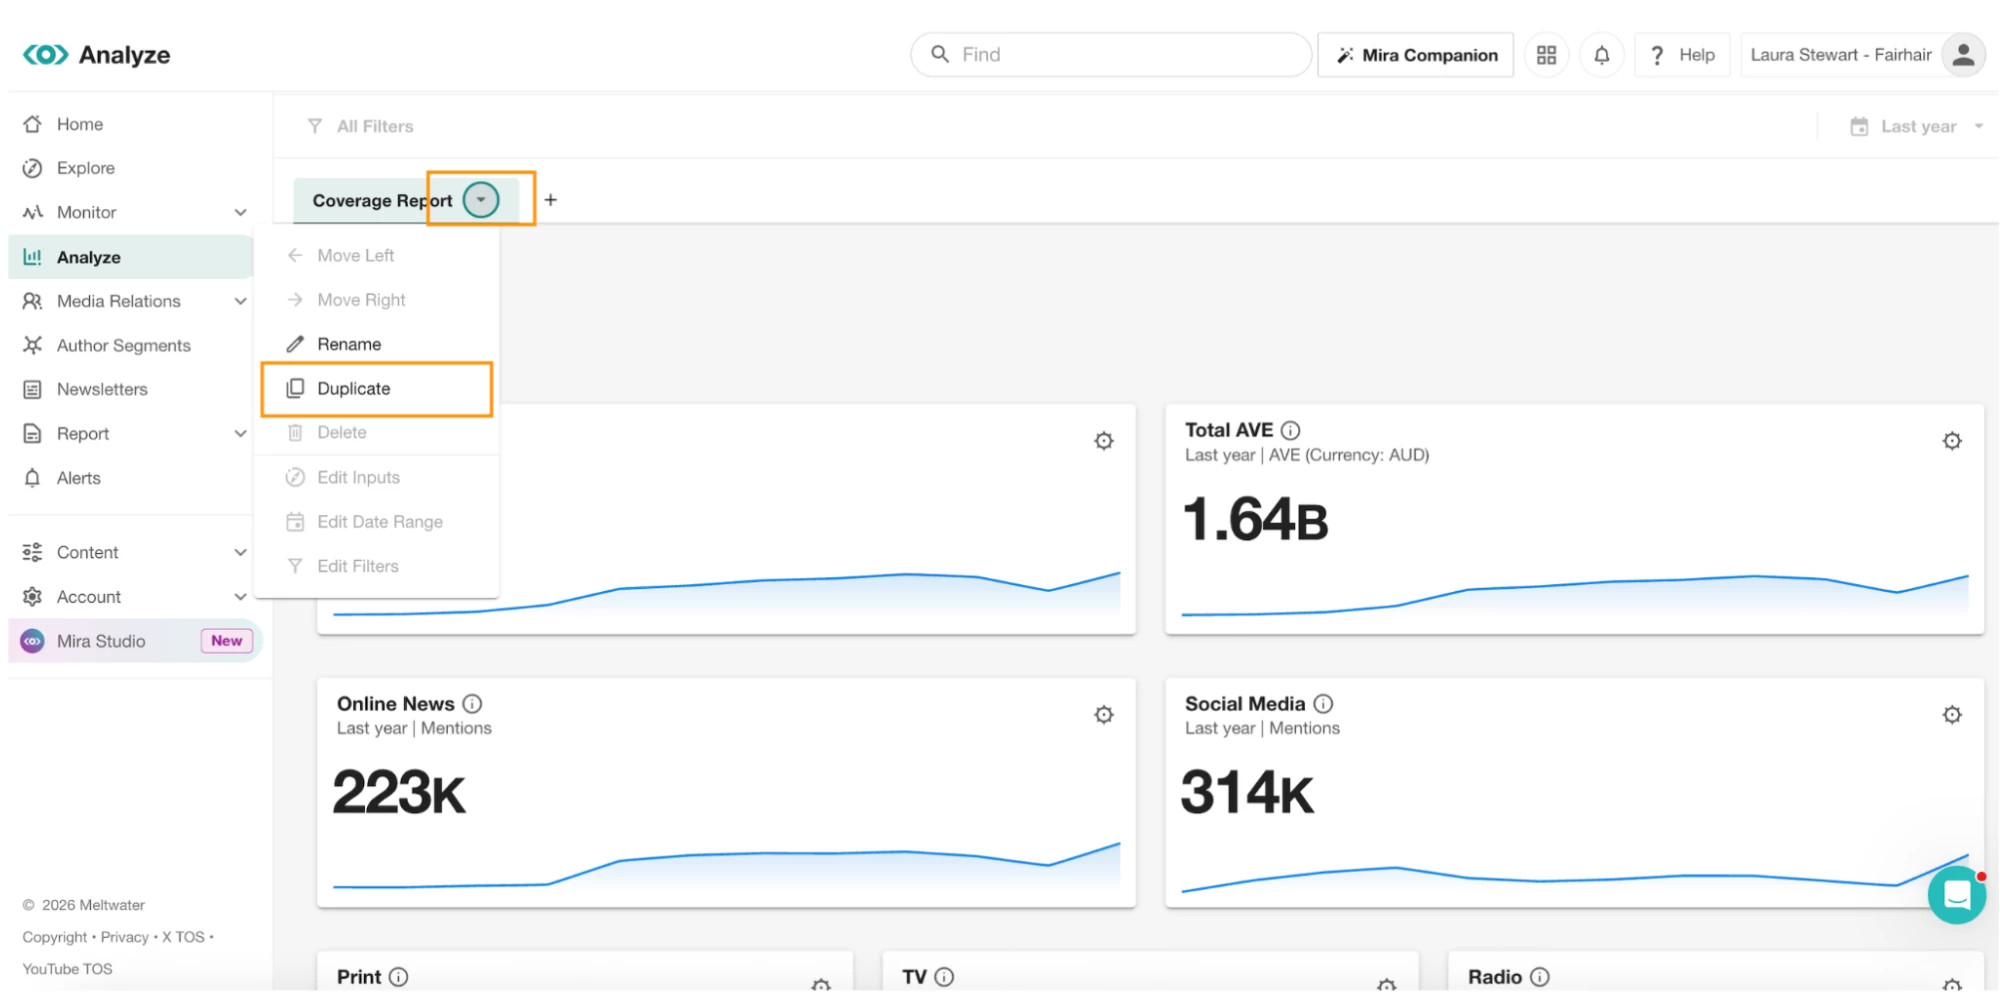
-
In the new duplicated tab, click the drop-down arrow and Edit Date Range
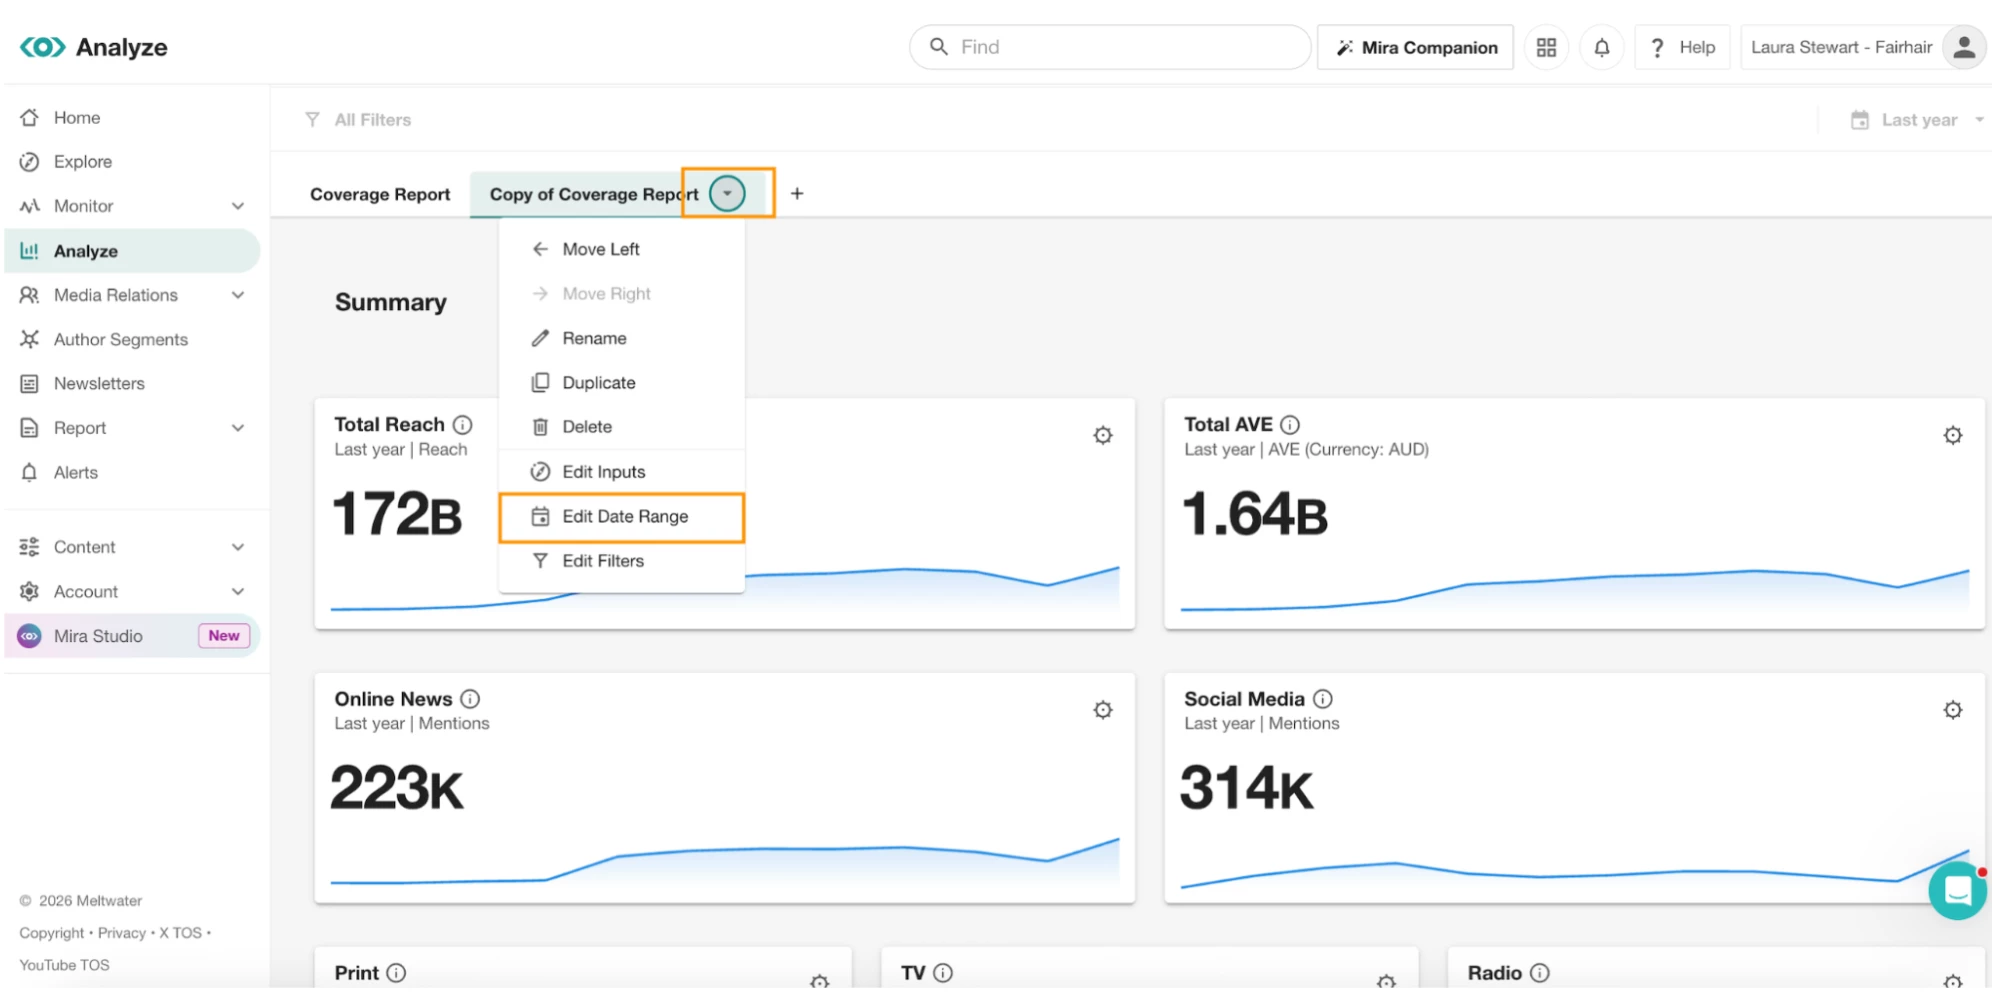
- Select this year in the pop out window
You now have two tabs — one showing last year's data and one showing this year's — giving you a clear before-and-after view to anchor your new reporting baseline.