Solved
Split of coverage
We would like to see a percentage of our coverage is national/consumer/regional/trade, is there a way to easily do this?

We would like to see a percentage of our coverage is national/consumer/regional/trade, is there a way to easily do this?
Hi
I’d be happy to help you create a report comparing national, regional, consumer, and trade coverage using Meltwater’s Explore and Analyze tools.
Start by creating dedicated searches in Explore with consistent filters for each coverage type:
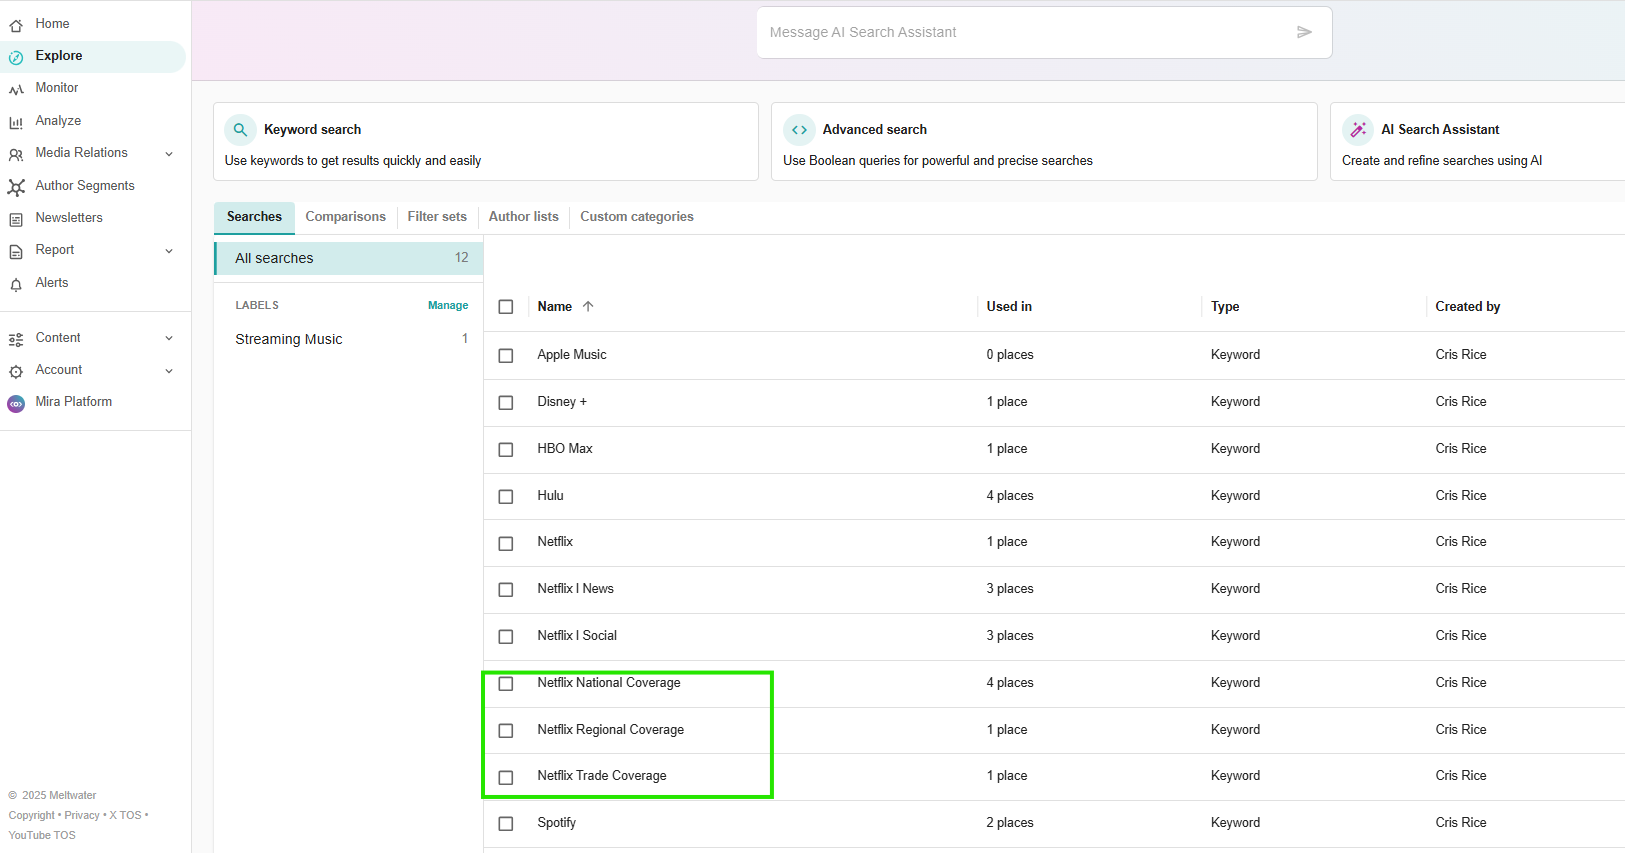
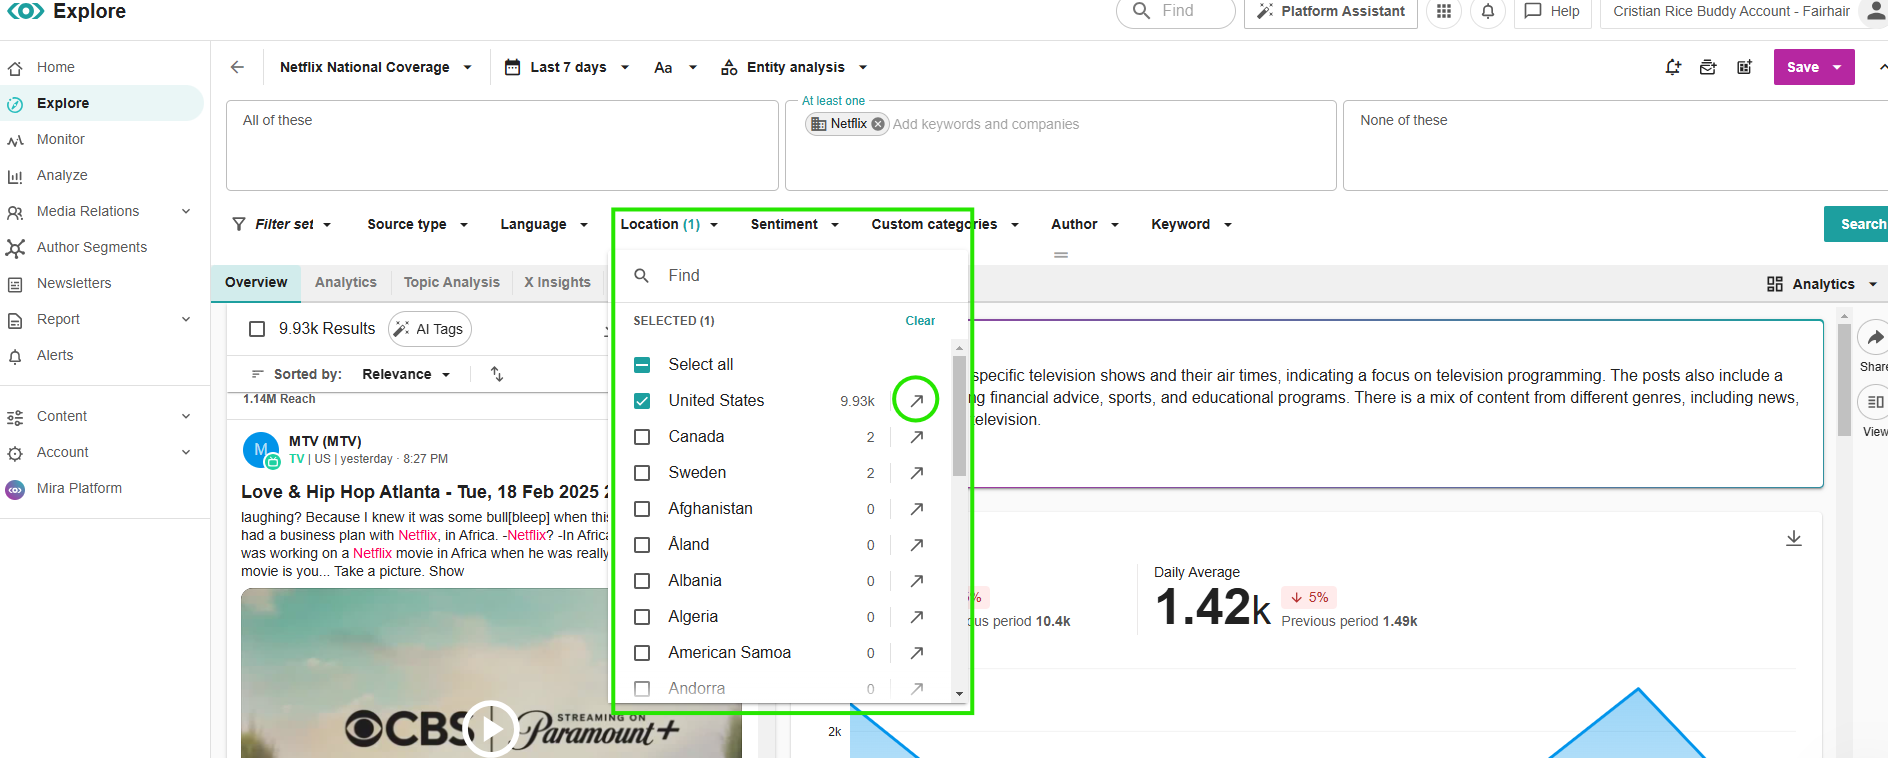
To Filter National Coverage:

Select the Country you wish to see coverage for and save the search.
To Filter Regional Coverage:
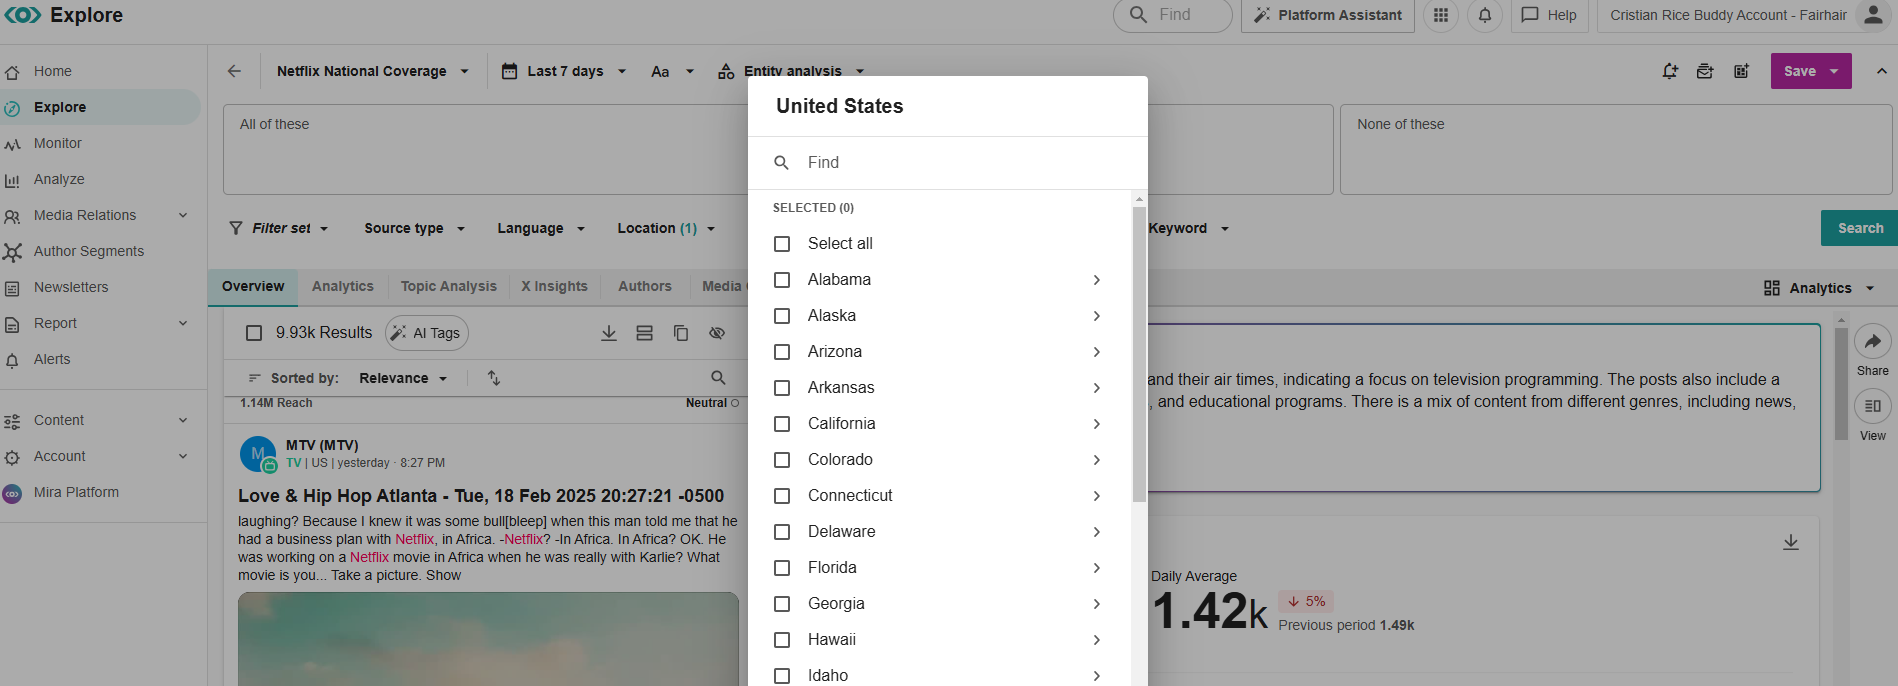
Select the Region you wish to see coverage for and save the search.
To Filter Consumer/Trade Coverage:
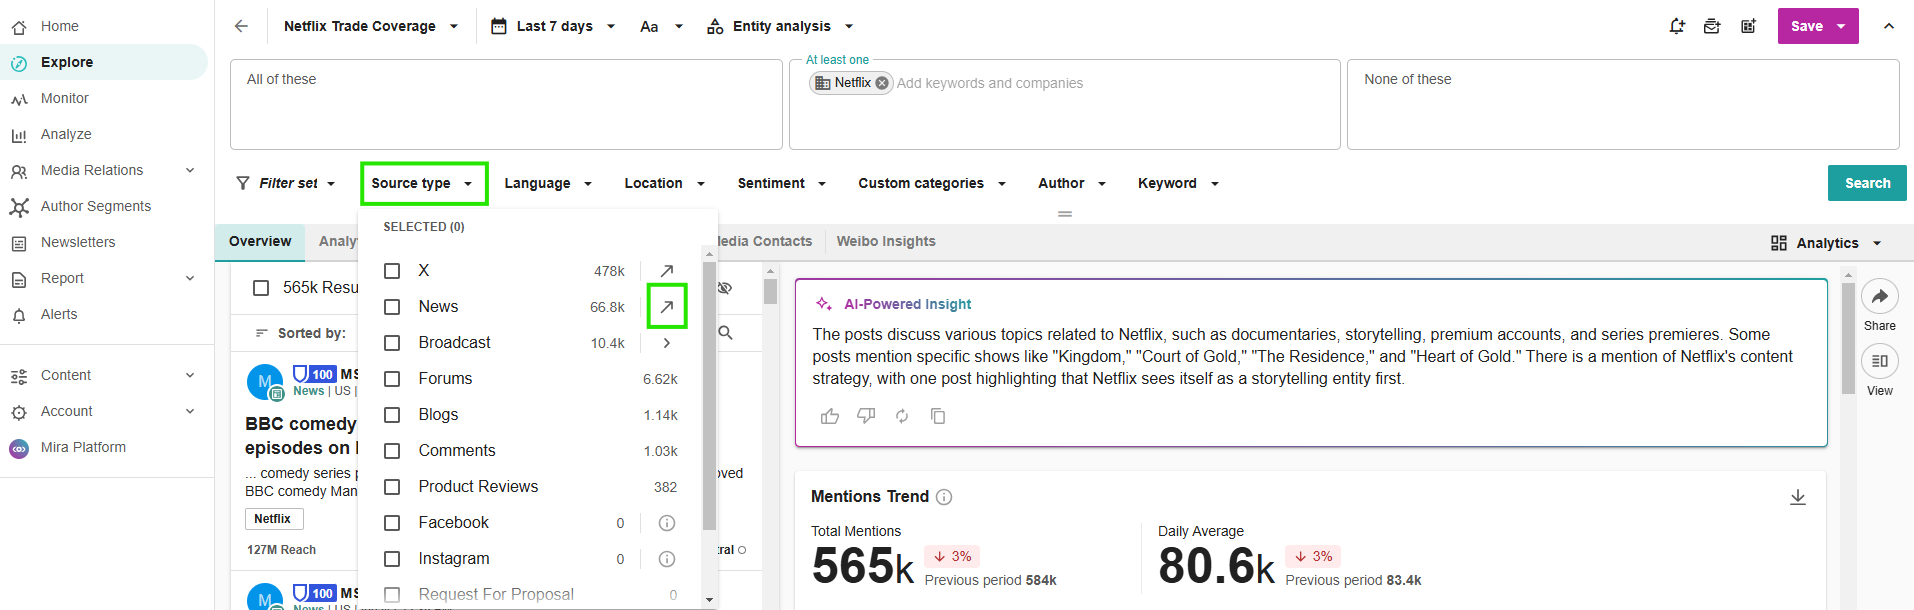
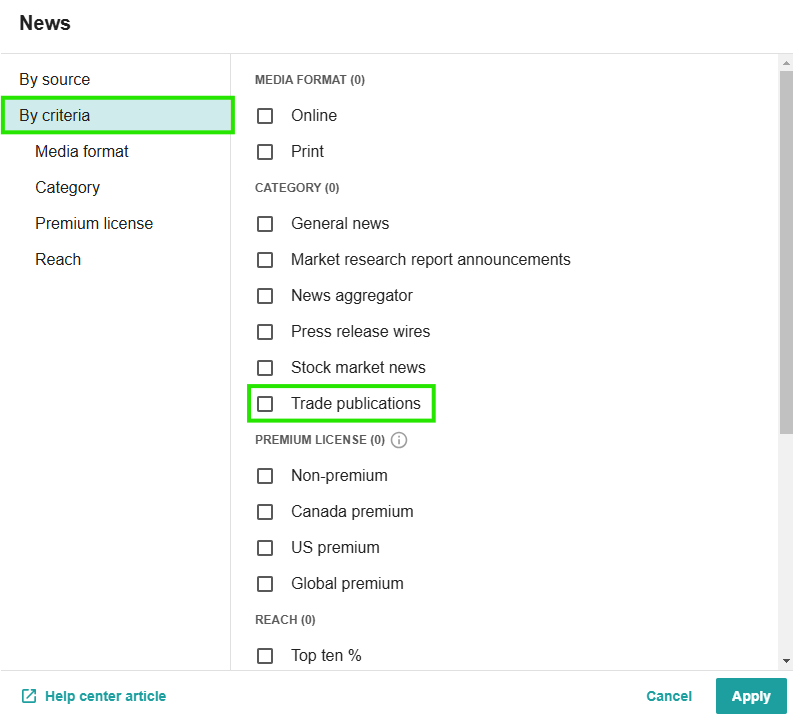
Select the Consumer/Trade Publications you wish to see coverage for and save the search.
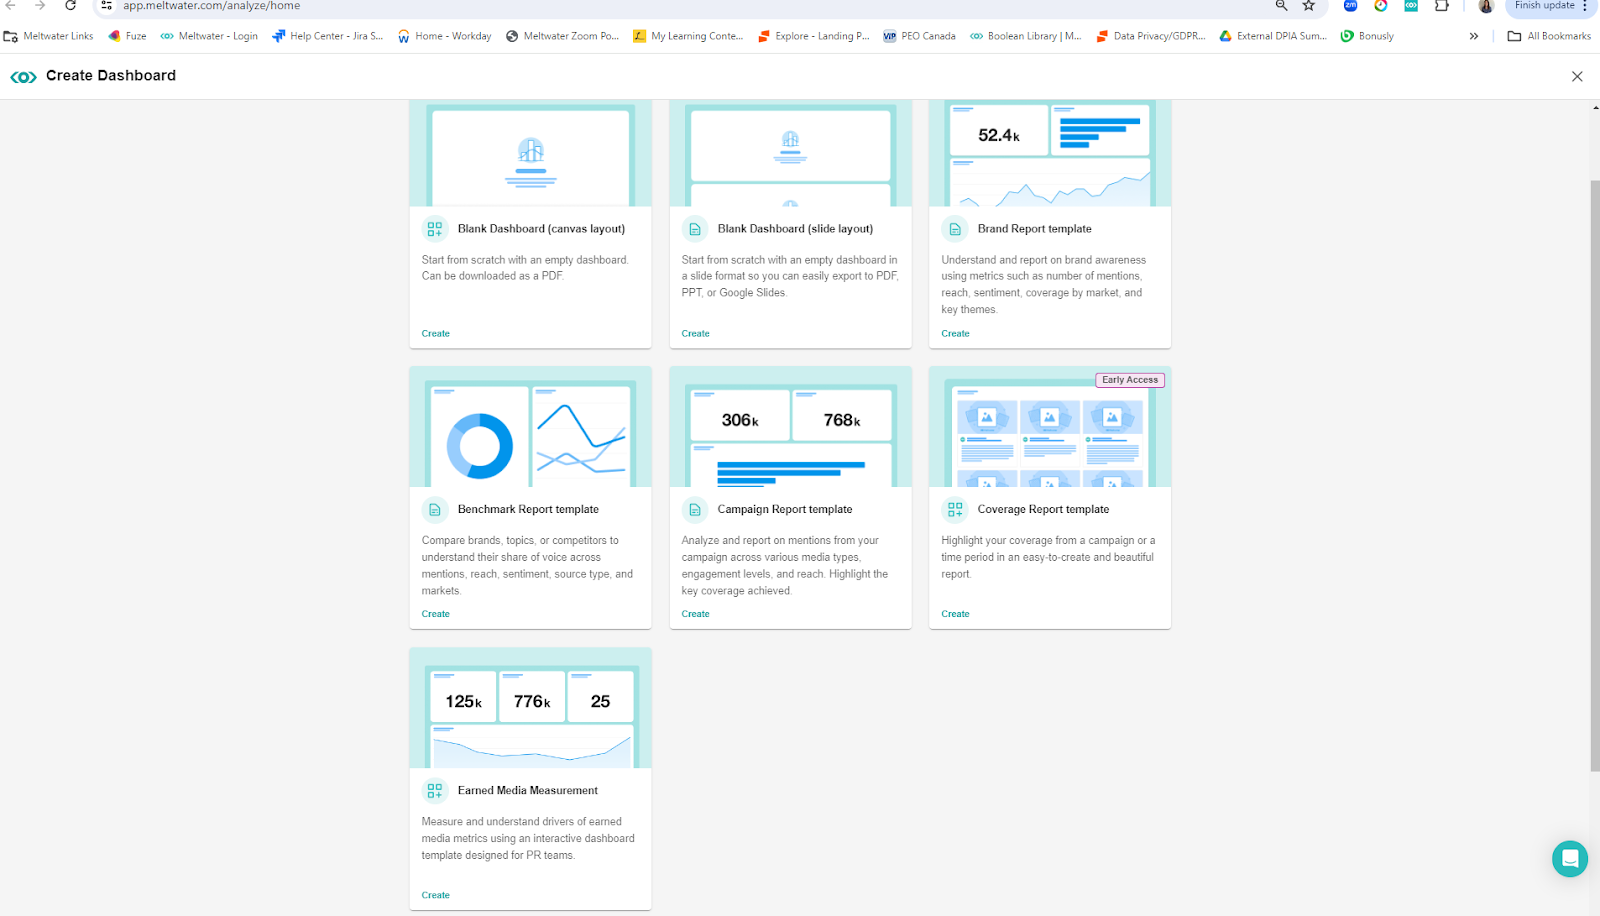
Once your searches are saved:
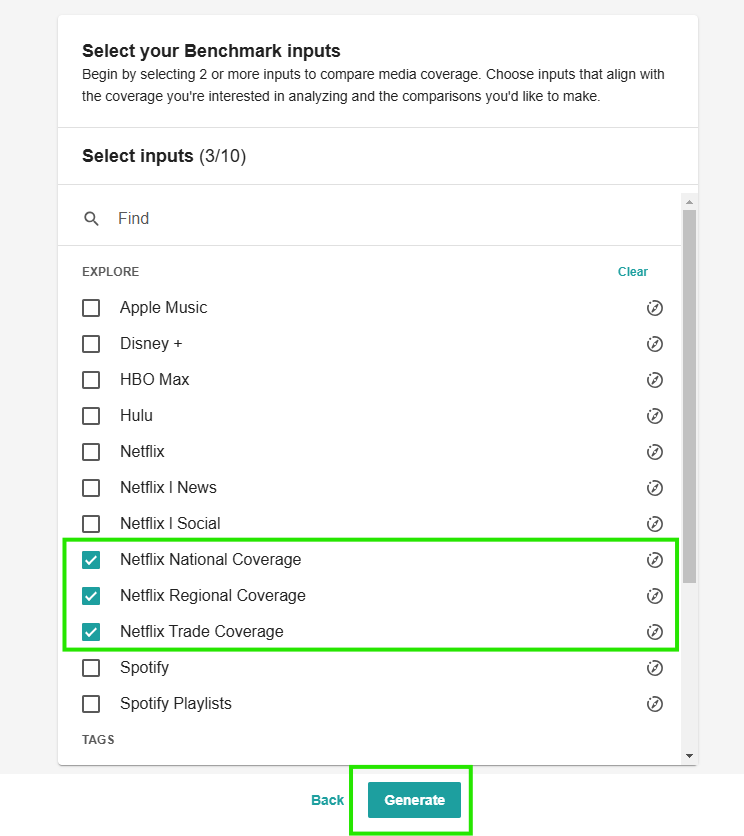
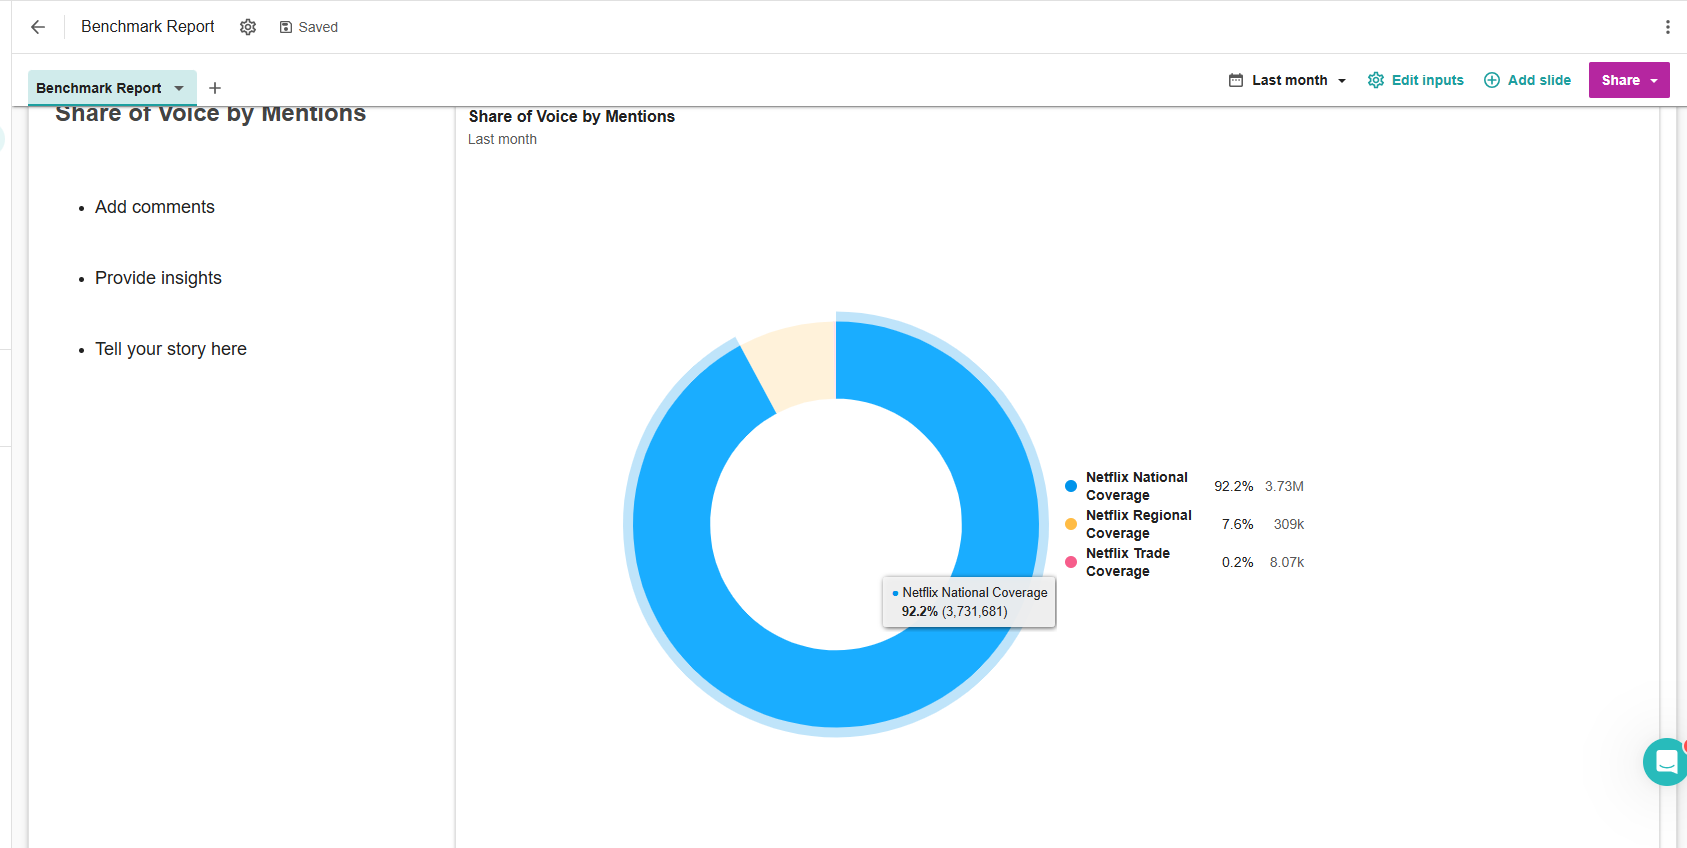
On the second slide, you’ll see a Share of Voice chart showing the percentage breakdown by mentions for each coverage type.

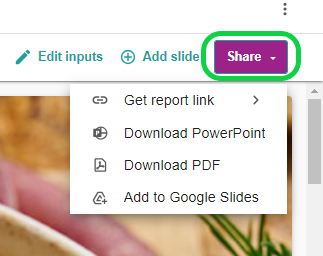
Once you're happy with the report:
I hope this helps, feel free to drop any questions in the comments!
Enter your E-mail address. We'll send you an e-mail with instructions to reset your password.