

Community Analysis Boolean Part 1
This week, we take a closer look at online communities and how advanced technology can help to identify and better understand these consumer groups. There is so much brands can learn, from the way audiences communicate to simply how they behave online. The tribes forming organically around shared beliefs, dislikes or even geographies are known for their engagement, fandom and often wit and knowledge. They are perfect for gathering social listening insights!
I’ll deep dive into two specific case studies, outlining how we utilize the advanced bio operator in Explore:
- Hispanic Trendsetters (today)
- Dental Health Care Providers (Thursday)
Let’s go!
Case Study 1: Hispanic Trendsetters
Business Objective
Identify and categorize online stakeholders of Hispanic heritage into communities (tribes) to better understand their interests in our category and pop culture
Context
I was advised by my team that “Hispanic Trend Setters” carry a significant amount of influence in the country, as well as pop culture. To ensure we capture brand conversation across the most prominent groups, we not only focused on well-known influencers from the region, but also everyday product users. As a business, we know that we under-index in sales to minority groups and our goal, year on year, is to improve on that.
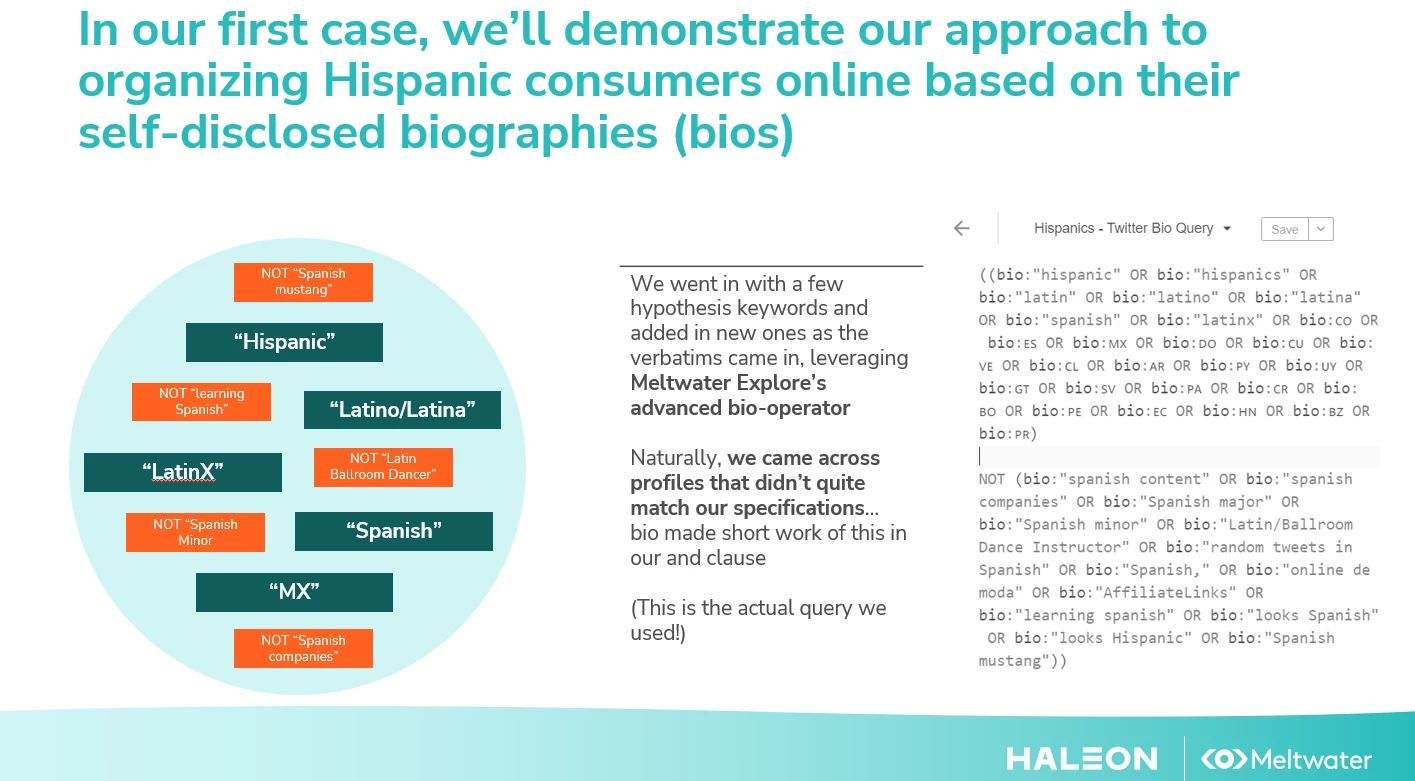
Step 1: Building the Query
As a team, we brainstormed and came up with a few hypothesis keywords to start the search, and continued to add new ones as the results came in. We used Explore’s advanced bio operator to create the query.
Naturally, we came across profiles that didn’t quite match our specifications - this helped us improve the query and ensure we exclude “noisy” or irrelevant mentions. Take a look at the actual keywords (and operators) we used, particularly the exclusion terms:


Step 2: Identify Trends to Refine Query
By reviewing content that came in, we were able to quickly learn some of the habits and preferences our audience displayed online.
-
Many users would use flag emojis to indicate their nationality, we knew we should include this in the quarry for accuracy. Using Explore, we simply entered the country/emoji code/flag into the bio operator!
-
At later stage, we would use these country indicators as an additional way to categorize consumers and explore how product usage varies by country


Step 3 : Discovery Process
Once the query has been refined for Hispanic consumers, we were able to uncover insights into how and why they talk about our brands. Let’s look at this in relationship with the Chapstick Brand.

Step 4 - Categorizing Key Findings
Using the from: operator, we were able to take our analysis step further and categorize our Hispanic ChapStick lovers (or haters) into a community, some in the industry call it a tribe - take your pick! The most important point here is that we’re able to have an ongoing stream of data and insights stemming from this consumer group.

What I was interested to find out was whether there are differences between users in specific countries (i.e. Mexico vs Argentina):
-
Do morning routines vary by background?
-
When, during their day, are they most likely to use ChapStick?
-
How does cultural background impact usage?
This online exploration, called digital ethnography, enables us to learn more about our audience and go beyond specific product usage. By analyzing collected content, we were able to zoom into
-
Hobbies
-
Music preferences
-
Travel plans
-
Cooking and eating out habits
All this provides incredible background and insight to the brand team on language, potential partnerships and collaborations or new product releases. It can confirm hypotheses or set a new direction to explore.
Read Part 2!