

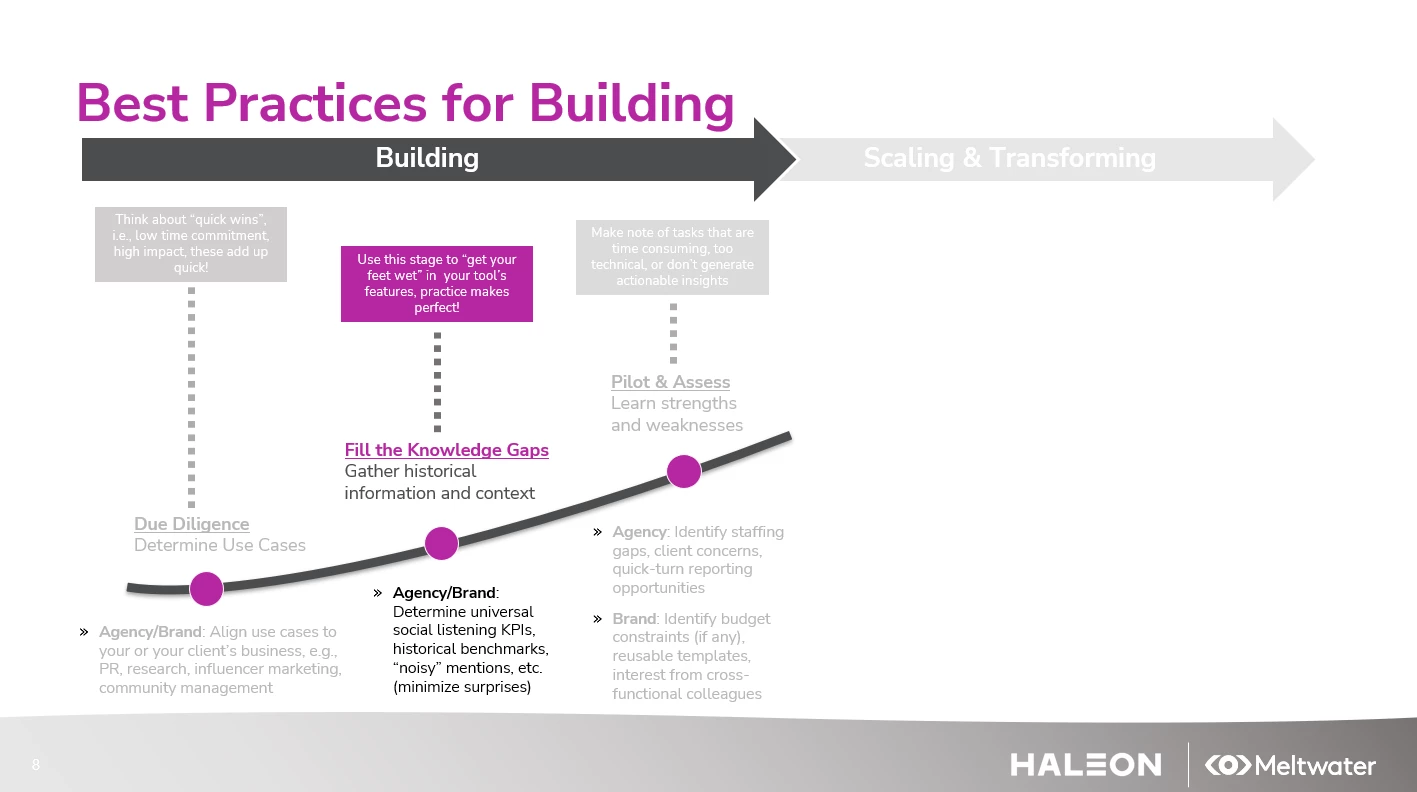
Maturity Model Part 3: Fill the Knowledge Gaps

The next step of the Building Phase is to fill your knowledge gaps. This means gathering historical information and context.
When you’re first starting out, you usually won’t have any idea what the historical figures are for your brand(s). Filling in these gaps are crucial for future planning and benchmarking - that’s why we care so much about the depth and breadth of data!
Historical Information
When gathering historical information, there are 4 key pillars to cover.
1) Volume Benchmarks and Seasonality
One of the most common questions I get asked is how did this conversation look like a year ago? A month ago? 6 minutes ago? Ok, maybe not the last one but for brands that experience seasonality, like Flonase, ChapStick, Emergen-C, Robitussin, and Theraflu, this is a big deal! How do we know if seasonality translates from the real world to online?
This is why it’s important to run your queries retrospectively over the past 12 months or, ideally, the most recent calendar year. This way you can easily observe seasonal spikes and have those metrics handy as benchmarks moving forward.
2) Averages
Spikes in conversation happen all the time, and it regularly throws off month-over-month metrics. Imagine, your brand spikes one month and generates 1M likes. Then, the next month you get 200k. When you run a 12-month review you’ll likely notice some obvious skew in your average.
Using an average is only possible if you have historical data. Once you have it, creating a 7-day, 30-day, or 365-day rolling average will be a piece of cake. These will help control and explain data anomalies mentioned above.
3) Noisy Mentions
The bane of every social listening analyst’s existence - noisy mentions (you may have a more explicit name for this). Boolean logic can only get us so far when it comes to nailing down relevant keywords. Some sentences will simply return results we don’t expect or data not related to our brands.
Take these brands to see what I mean by “noisy mentions”:
- Apple (computers not the fruit)
- Subway (the sandwich shop, not the transportation)
- Delta (the airline, not the COVID-19 strain)
- Band-Aid (the brand, not generic “bandage” mentions)
- EOS (the lip balm brand, not the Canon camera mentions)
- Allegra (the allergy brand, not the woman's name Allegra)
These examples might be obvious but every brand will have their share of “oh that’s interesting” moments when exploring data. Never a dull moment.
The build phase is the perfect time to identify these logic conflicts and instances where your brand queries pull in “noise”. It’ll save you a ton of time and headaches later! Speaking of headaches…
4) Cultural Ties
Some brands are better known than others, but the size isn’t a requisite for being embedded in pop culture. Advil is one of our most discussed brands online. In the early days we regularly gathered mentions of “Sunglasses and Advil, last night was mad real”- a reference to a 2012 Kanye West and Jay-Z song called “No Church in the Wild” (100M+ views on YouTube).
This is a popular phrase from a popular song and has held up well over the years. These might be free mentions for us as a brand, but from the insights perspective - it actually creates more noise. They don’t tell us anything about how people use Advil. We’ll take the brownie points for making it into a Kanye and Jay-Z song but that’s all these mentions are good for.
All of our brands have their own unique insights and cultural ties, some more pronounced than others. It’s up to you to identify what these insights are.
Add Context
If you’re just starting out, there’s a lot of really basic information you won’t know. Here’s some steps to fill in as many gaps as you can.
Familiarize yourself with the size of conversation and know which brands have the largest share of voice.
-
If you’re P&G, you should know whether it’s Tide or Charmin that generates more mentions and why. Tide (pods and detergent, not high tide, Crimson Tide, etc.) you’d expect to be larger than Charmin after all its press around the viral internet trend; Charmin actually generates slightly more mentions.
Understand the competitive landscape.
-
If you’re Unilever, you should know Vaseline's share of voice, relative to Blistex, Carmex, ChapStick and Burt’s Bees. This is actually straight from our competitor cohort, where our ChapStick brand typically observes 70%+ share of voice, with Vaseline coming in on average b/w 5-10%. Not every category is this disparate online, so figure out which brands are big, and which aren’t!
Broaden your dataset and discover other brands mentioned alongside your product.
-
If you’re Care/Of (subscription vitamin service), what other supplements are being mentioned (i.e., taken) alongside your product? Calcium? Zinc? Some of these you’ll know going in, but be on the lookout for things that aren’t on your checklist.
Understand the whole category conversation.
-
If you’re Biofreeze (multi-form pain relief), what does the back or joint pain conversation look like online? The whole category is a white space where consumers are talking about what Biofreeze treats, but may not mention them by name.
Keep checking for seasonal occurrences.
-
Pumpkin Spice Latte is a seasonal promotion, does that mirror the social media conversation? In this case for a brand like Starbucks, it does.
-
Haleon’s owned brands observe seasonality online too. Our cough/cold/flu brands spike in the fall/winter, and in the spring it’s our allergy brands; this is important to reaffirm early on.
And that just about covers the knowledge gaps, no pun intended.
❔ Share your examples of noise and cultural gaps - there’s so much learning stemming from these!
Tomorrow, we’ll wrap up the final step in the building phase: Pilot & Assess.
ICYMI
Here is the full series: