Now let’s create a presentation-ready report about your brand’s (Earned) media coverage.
- Select Analyze in the left-hand navigation bar
- Click on the purple Create Unified Dashboard button

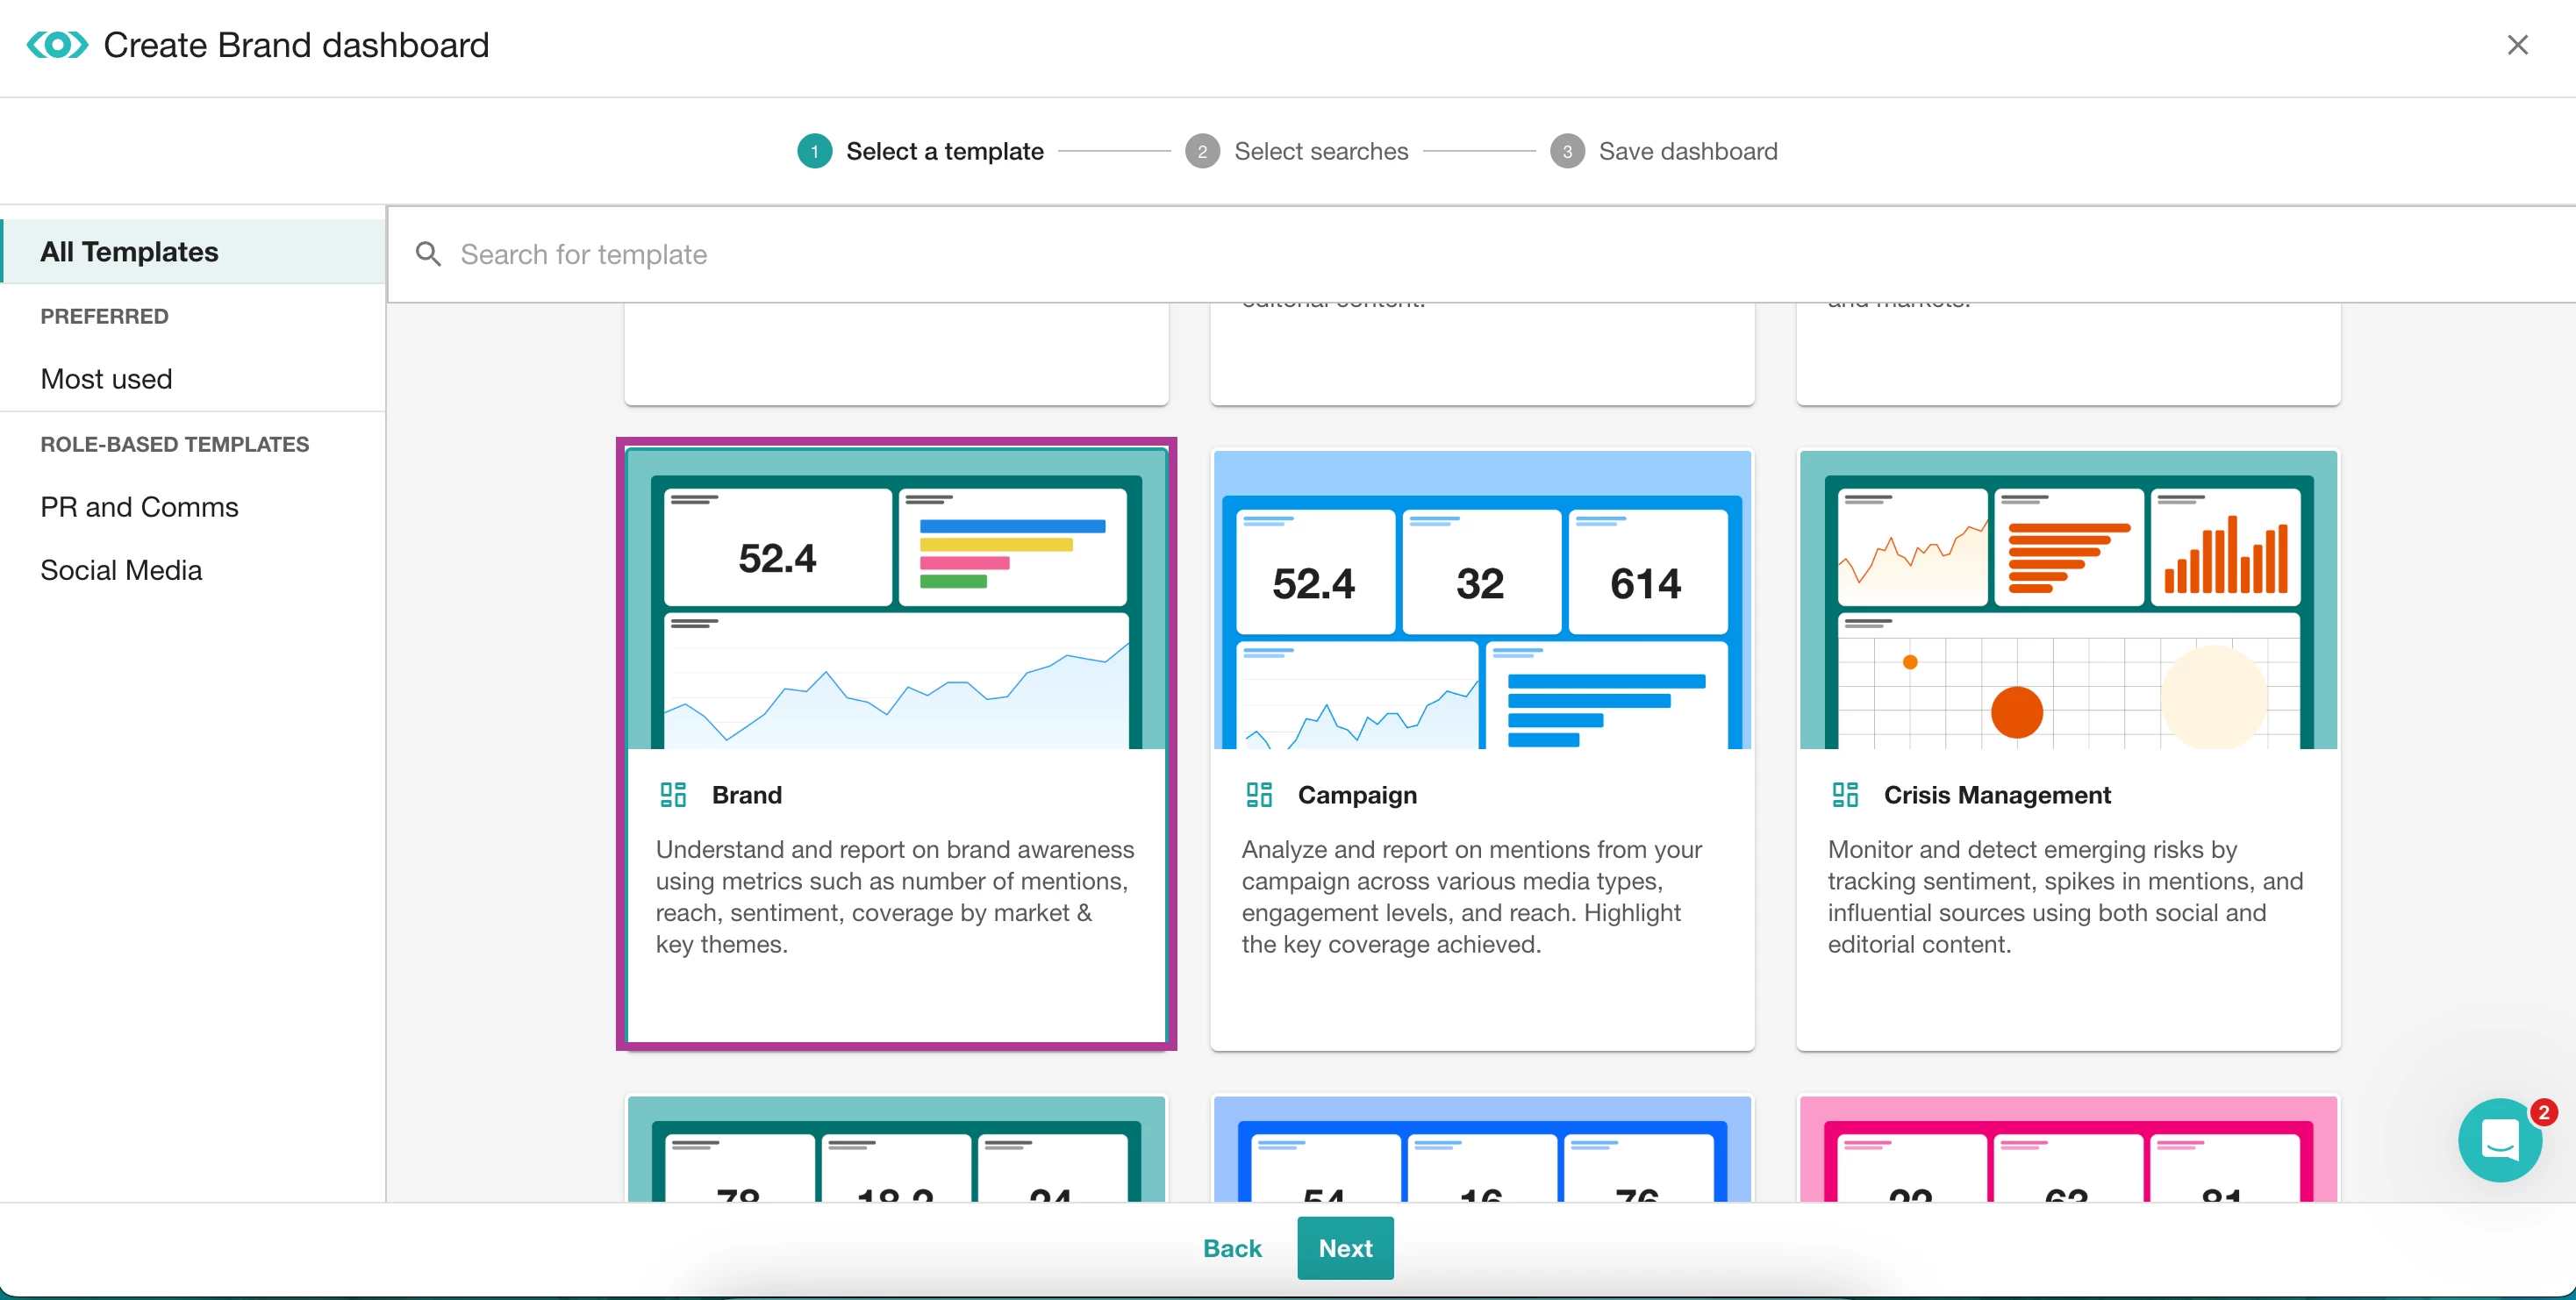
- For your first report, let’s use the Brand Report template option.

- A new page will open; select the saved search(es) you created earlier.
- Click Next at the bottom of the page
- Rename your dashboard and add it to a folder
- Click Create
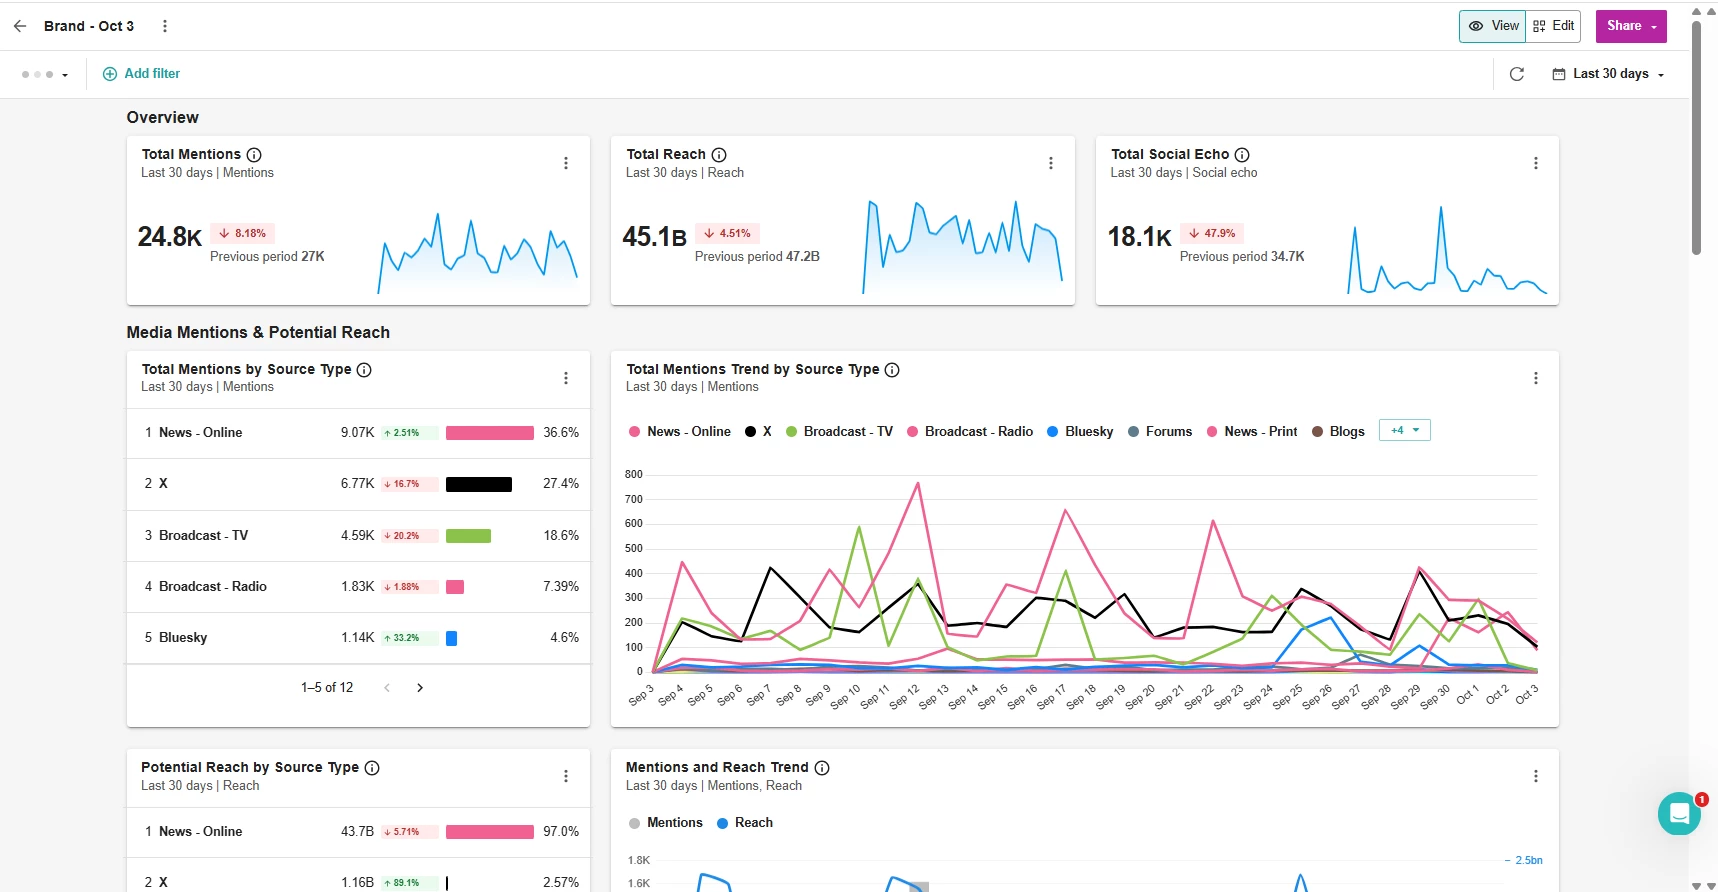
- A report has been generated for you with our most popular insights and analytics about your brand/company. Scroll down the page to see all the insights.

- You may want to adjust the time period of the report.
By default, the report will be based on the last 30 days, but you can adjust your time period in the top-right corner near the purple share button.
- Our reports are fully customizable, allowing you to tailor them to your needs.
You can input your own insights, add or remove widgets, and even upload a custom cover photo. Feel free to explore all the customizations at your own pace!
- When you are happy with the report, click Share in the top right-hand corner.
From there, you’ll be able to download this as a PDF, PowerPoint, Google Slides, or share the link with your colleagues to view the report in their web browser. Check out the help article to learn more.
Available Training
If you want to dive deeper into creating and refining searches, check out these helpful resources:
- Enroll in our Reporting & Dashboards Academy course for a comprehensive walkthrough of Meltwater’s dashboard features.
- Join for one of our Monthly Getting Started with Report Building to learn with others and ask questions in real time.
- Watch the previous Getting Started with Report Building Workshop recording
- Read the Earned Media Measurement Dashboard Guide
- Check out the Dashboard Reporting Playbook that offers step-by-step videos to help you set up your dashboard in minutes.
Advanced Reporting options:
- Watch the Level up your Meltwater Reporting Workshop for expert tips.
- If you want to measure your Owned Media (your subscription will need to include the Engage Product) take the Measuring your Owned Social Course


