New Releases for Explore announced in the Winter Release 2023 Product Update Webinar!
Updates include:
Location Data for Instagram Content
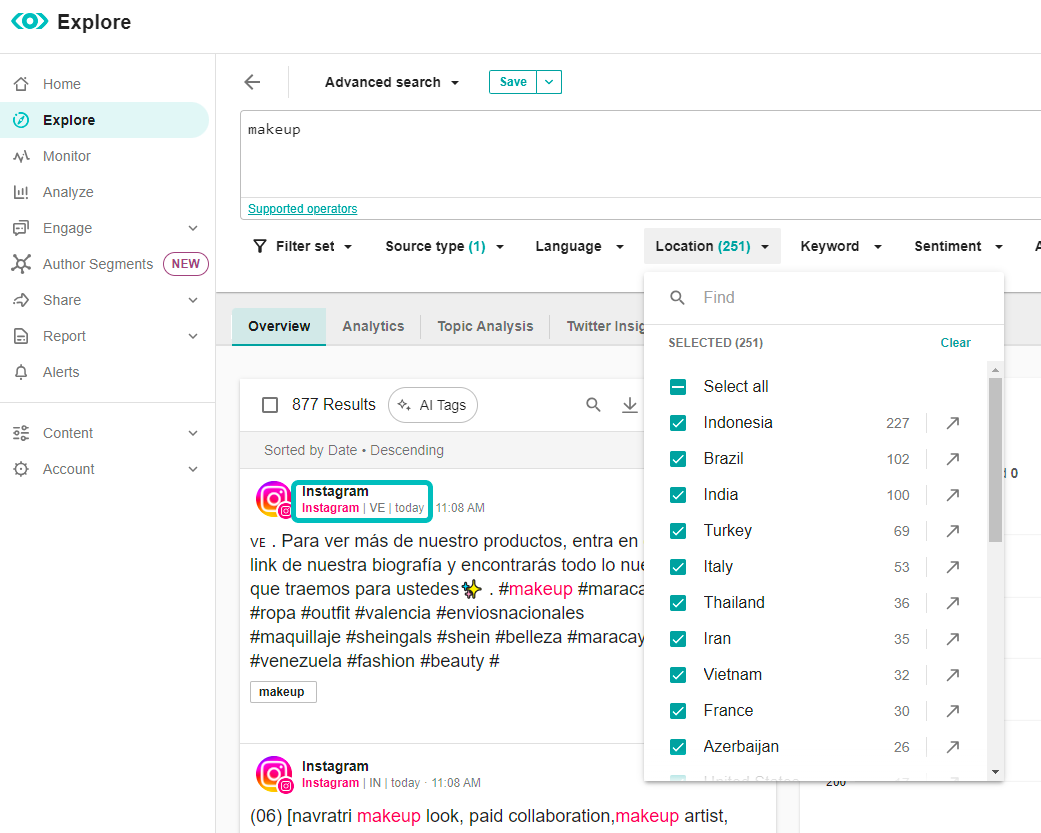
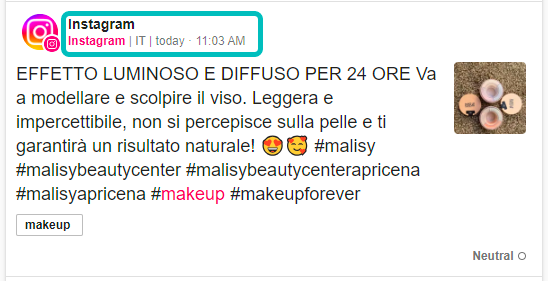
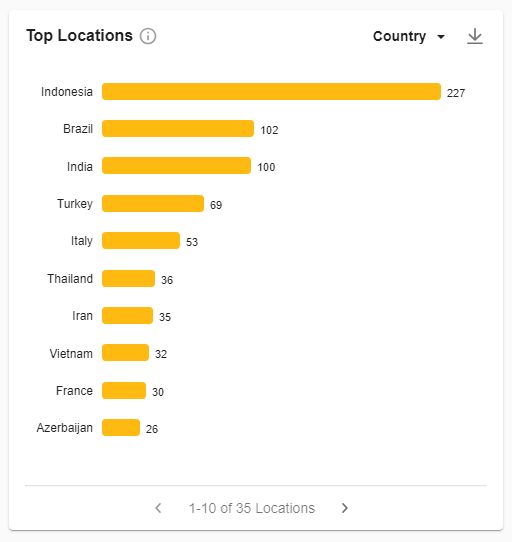
Location now available for Instagram content in Explore
What is it?
Location data is now available for Instagram content in Explore results! 
Location data is AI-based, using post-level data, such as hashtags, language, user bio, etc., to infer the country/location of the person/handle.
Not all Instagram content will include location data. This is due to privacy settings and other limitations on Instagram.
What’s the value?
- Deepen audience understanding:
- By capturing where posts originate from, our users gain additional context on their audience sets. In other words, our users deepen their understanding of their audiences.
- For example: knowing where their audiences live or reside can help Communications Pros run more targeted and location-relevant content or campaigns.
- Consistency Amongst Tools:
- Instagram location data is included in Radarly, Meltwater’s Consumer Intelligence offering. By also including this information in Explore, you can expect a more seamless experience between tools.
Screenshots:
Learn more in the Help Center:
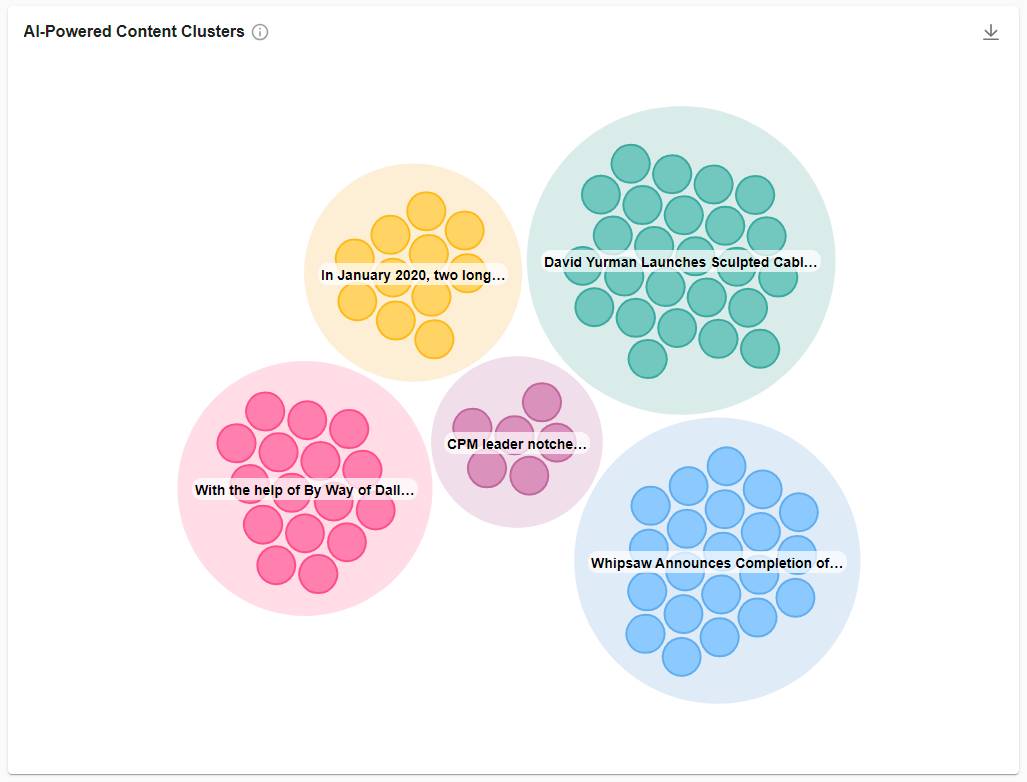
Bubble Chart Visualization for AI-Powered Content Clusters
A visual representation of the relationship between content clusters
What is it?
A new bubble visualization for AI-Powered Content Clusters!
Combining related search results based on topic similarity, organizing similar stories together, in an easily readable format.
What’s the value?
- Save Time:
- The new bubble chart visualization for AI-Powered Content Clusters helps better articulate the size and scale of each individual cluster in relation to one another.
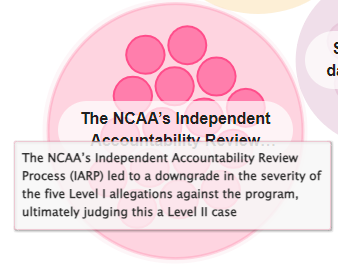
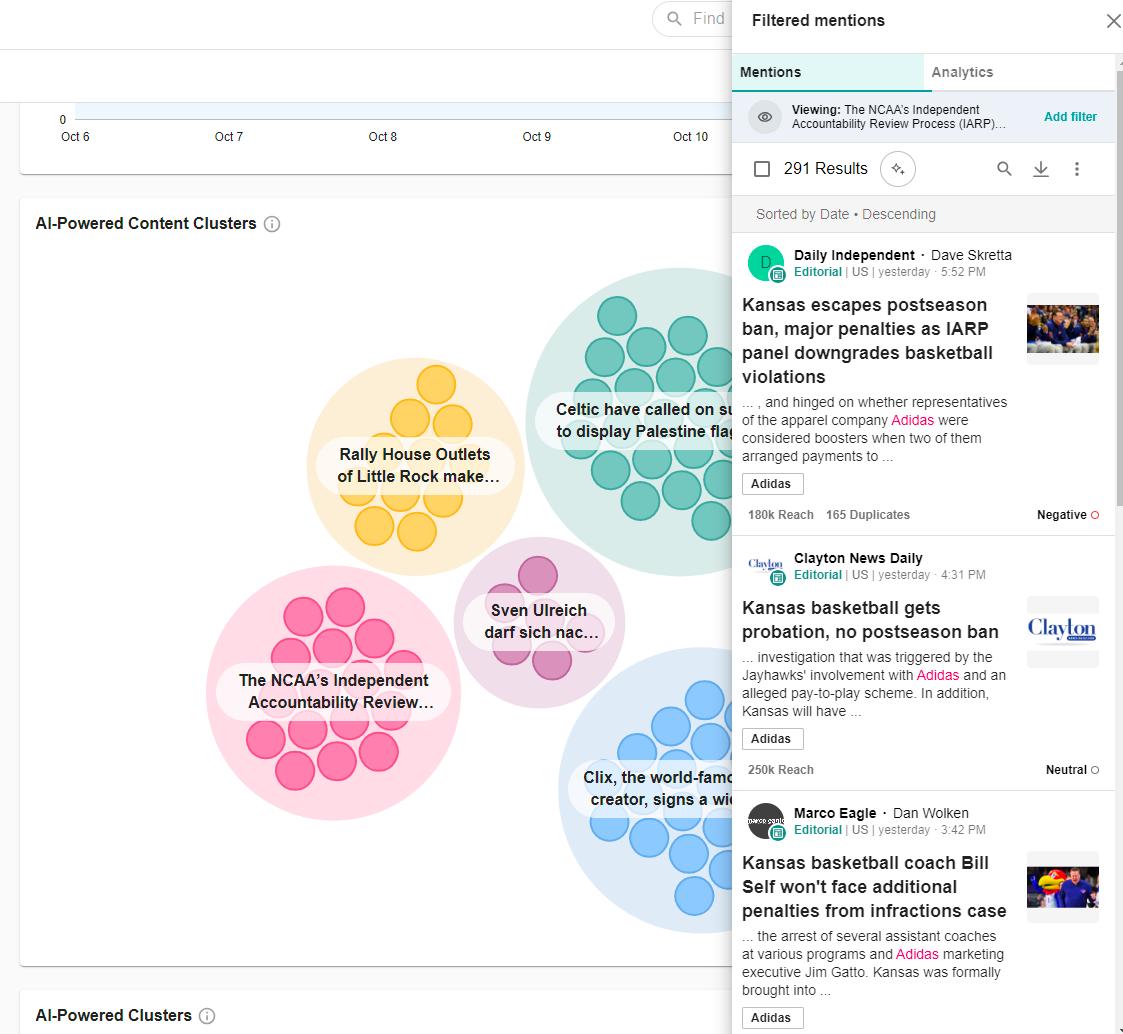
- Organizing mentions into color-coded, scaled bubble charts helps better showcase the weight among clusters. Users are able to quickly identify the most relevant content by cluster with their generated summaries, saving hours of manual processing and summarizing.
- This chart is also more visually appealing, offering more opportunities for you to share Content Clusters with colleagues in presentations and reports.
Screenshots: