Several exciting new Explore updates this week:
- A new look and feel for widgets
- A new unifying content stream experience
- A new filter to increase usability
- Increase of topics expands classification by 198%
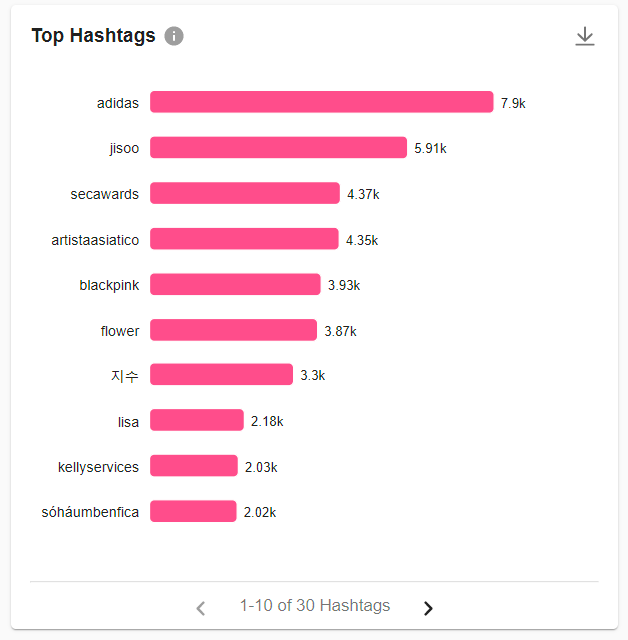
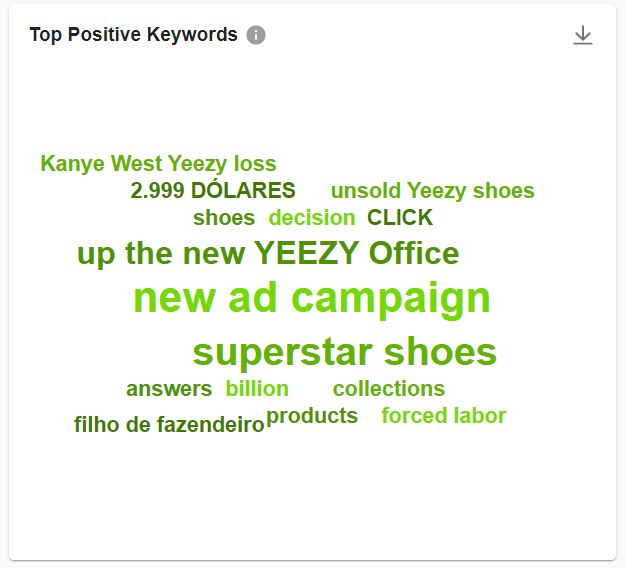
Updated Visualizations 2.0
What is it?
We’ve updated visualizations in Explore with a new look and feel, plus added data. Also, introducing the ability to download visualizations as a PNG!
This update combines with the previous releases, and now applies to the Overview, Analytics, Topic Analysis, and Twitter Insights tabs.
What’s the value?
- User productivity: Added data points, like delta points on the Top Hashtags bar charts, help you identify insights faster than ever before.
- Improved reportability: The ability to download PNG versions of widgets makes it easy for you to report and share insights with colleagues. Formerly, many users would take screenshots of widgets.
- Look and feel and ease of use: The new visualizations improve the visual appeal of Explore, making the product more inviting and accessible to use. By extension, the new look and feel also make the product easier to use.
Upgraded Content Stream on the Twitter Insights Tab
What is it?
The content stream in Explore has been upgraded to the universal Meltwater design for content cards. The new experience supports the filtered mentions side pop-out and the ‘Content Analysis Card.’ You will also find new displays for source types and custom categories, a compact view option, and new options for sharing and opening in a new tab.
This update combines with the previous releases, and now applies to the Overview, Analytics, Topic Analysis, and Twitter Insights tabs.
What’s the value?
The new enhancements help you identify, vet, and action relevant content quickly and efficiently. Second, by standardizing the content stream experience across our product suite, we create a more unified product experience and enable faster development for the future.
New Context Filter on the Twitter Insights Tab
What is it?
A new Context filter has been introduced to allow you to easily filter results in the Twitter Insights tab in Explore for metrics that do not already have a corresponding filter. These include the Tweet Type Breakdown, Authors By Authority Level, Top Twitter Authors, and Gender Breakdown widgets.
What’s the value?
- The new Context filter allows you to easily filter your results in Explore without needing to adjust your boolean. This makes research and refinement quicker and easier, allowing you to reach your conclusions faster.
- Since these filters are tab agnostic and can be saved as filter sets, it also allows you to easily generate new filter sets you were previously unable to.
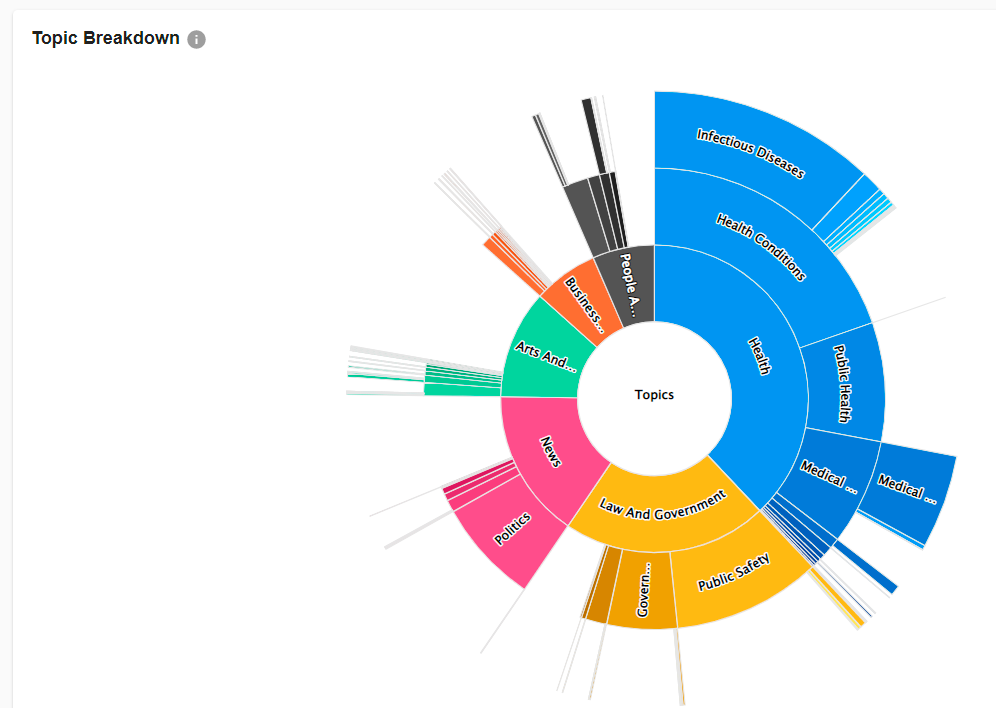
More Topics in Topic Analysis
What is it?
Topic Analysis is an exploratory research tool designed to help you understand the underlying meaning of the topics within your results. The number of available topics has been increased from 360 to 1,072 (a 198% increase), giving you better tools to synthesize key themes in conversations from a set of results, as well as understand the general tenor of those results.
What's the value?
Topic analysis provides a further level of exploratory detail, answering ‘What are the topics, themes, and meanings?’ and ‘What’s the tenor of this topic?’. By increasing the available number of topics from 360 to 1,072, we are providing customers with even more precise classification, allowing for more accurate and tailored reporting.
Note: the expanded topics are forward-moving only, so they will gradually appear in the Topic Analysis tab.