



A Guide to Using Meltwater’s Benchmark Report for Competitive Analysis
Hey mCommunity! Julia here from the North America Onboarding and Implementation team.
Recently, a client asked for assistance for an upcoming project - they required a competitive analysis between their company and two key industry competitors, focusing on share of voice and editorial mentions throughout 2023. This data would be used to inform their 2024 strategy.
Today, I’ll guide you through utilizing Meltwater’s Explore and Analyze tools to put together such a report, specifically comparing Summer Fresh, Sabra, and President’s Choice.
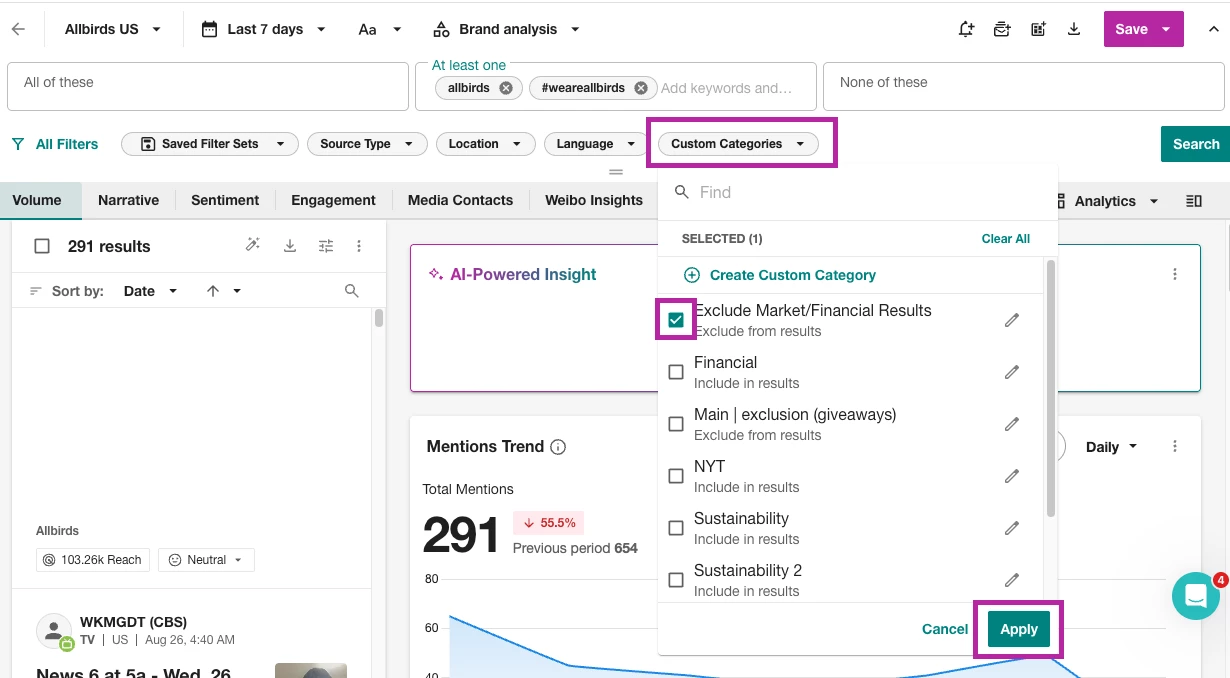
To start, ensure each brand has a dedicated search in Explore with consistent filters for a fair comparison. For this example, I’ll filter for editorial results only, while applying a custom category to exclude results specific to market news or financials.
Once the Explore searches are set, head to Analyze to select your report type. Once you select ‘Create Dashboard’ you’ll have a few templates to choose from or create a report from a blank canvas. Since we’re comparing three brands alongside each other, opting for the Benchmark suits our needs.
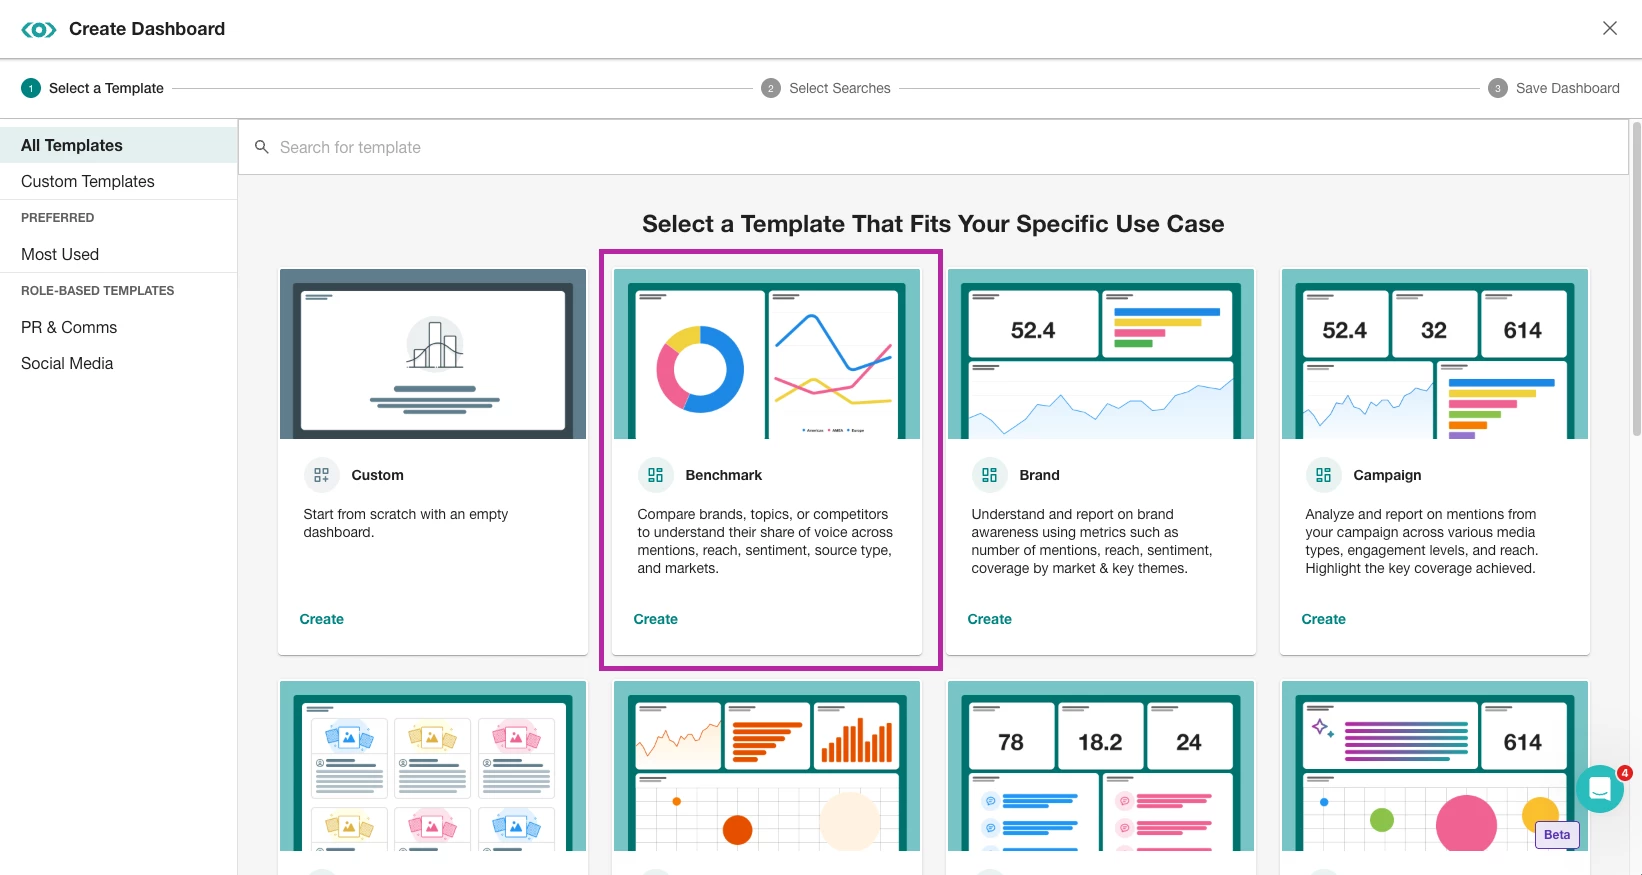
These templates offer quick setup while allowing customization options such as adding brand colors, logos, cover images, and additional metrics. After selecting your report type, choose your inputs and click ‘Next’. Select a folder and click ‘Create’.
As a first step, scroll through the report to determine if you’d like to include additional metrics (what Meltwater calls ‘insights’).
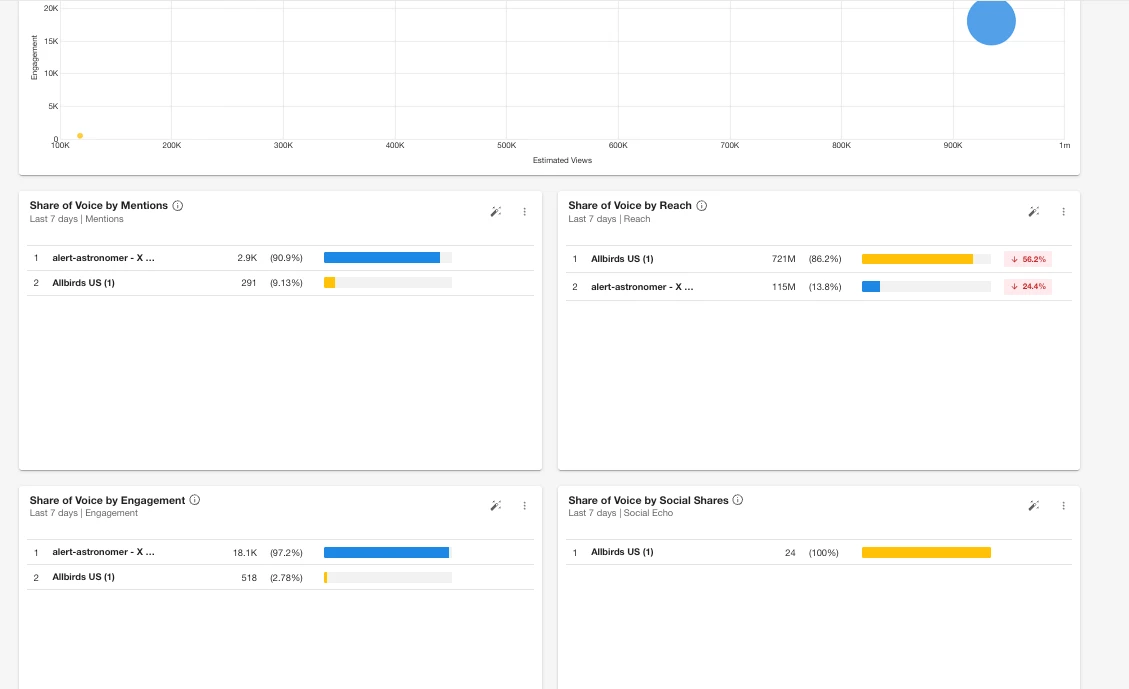
Learn more about Meltwater's supported insights.
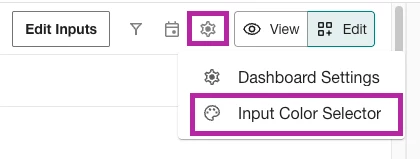
After adding insights, while remaining in ‘Edit’ mode, make the final touches by creating a title and any brand colors using our input color editor.

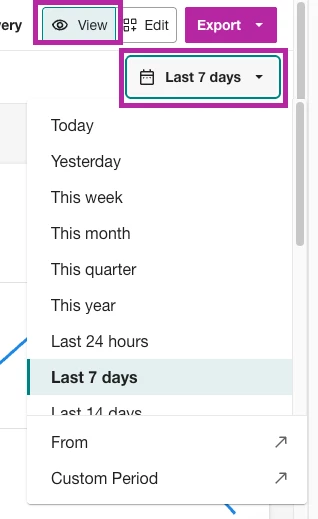
Finally, you’ll want to modify your date range by either selecting from one of the quick pick options or choosing a custom date range. For example, focusing on 2026 data using the ‘Custom Period’ option.
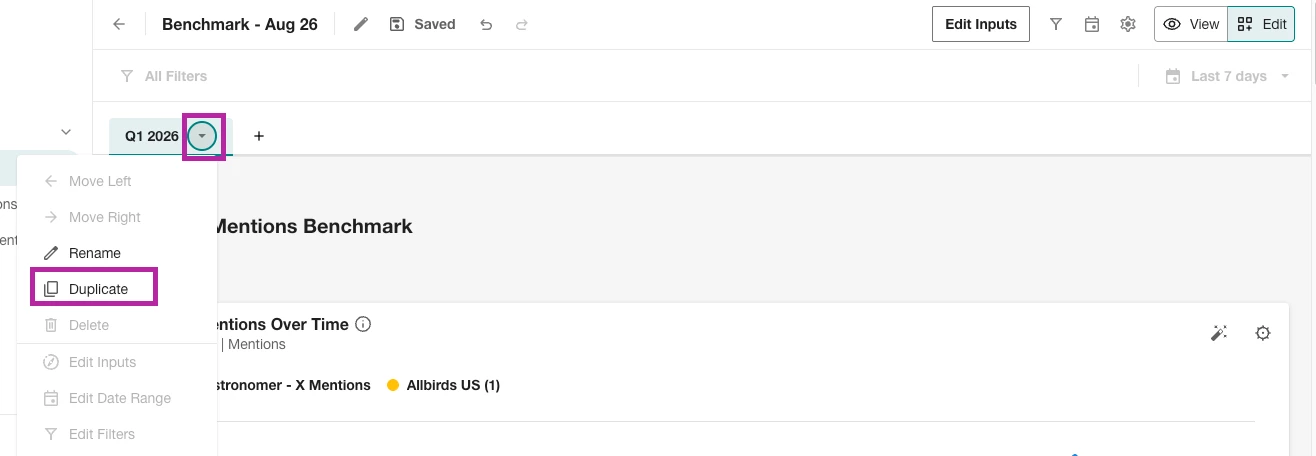
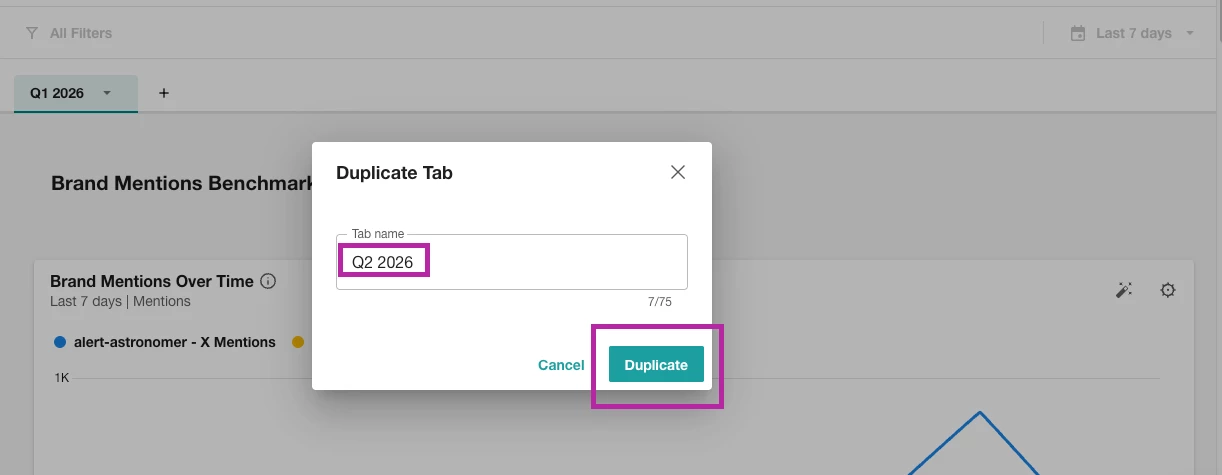
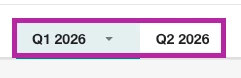
Some clients may prefer quarterly analyses, achieved by duplicating tabs and adjusting the date ranges accordingly, as seen in the below screenshot. For added organization, consider editing the tab name to Q1, Q2, and so on.
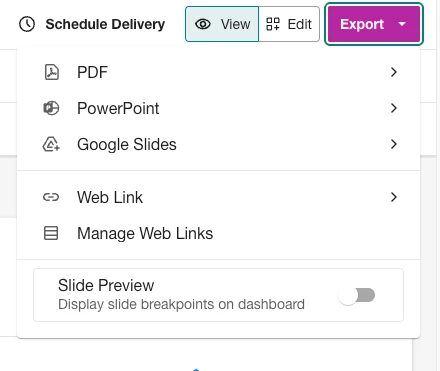
Once all modifications are complete, use the ‘Export’ button to share the report.
That’s it! I’d love to hear about your preferred report layout and how you use it in your daily work. Feel free to drop any questions in the comments!