



3 things I learned from taking Sam Knowles's course over the weekend
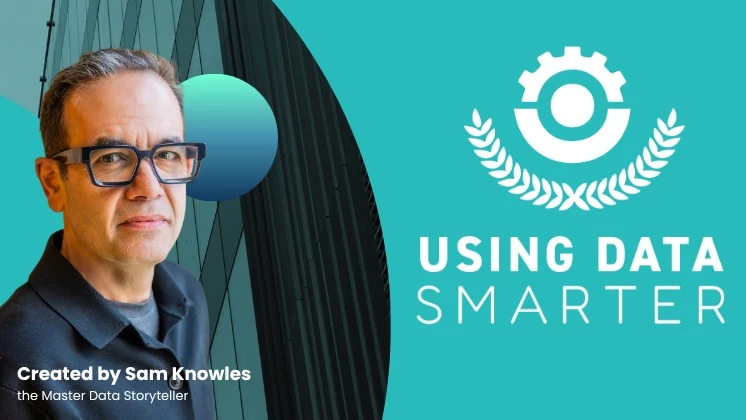
Sam Knowles has written three books on the topic of data storytelling. His new course on Meltwater Academy covers a lot of ground. I've summarized the main takeaways in the attached 15-slide deck, but here are my three favorite and most practical takeaways.
1. You have to get the brief right!
This is the one that saves you the most time, not the least. Before you touch a dashboard, write down who's reading this, how much data they can actually stomach, and what they need to decide because of it. Sam calls it a Pen Portrait, and it takes two minutes: project, audience, data tolerance, format. Finance can handle the detail, marketing wants the headline, the board wants one number and nothing else. Get that wrong and you're rewriting the whole report from scratch.
2. This, because of this, means that.
This is Sam's test for whether you actually have an insight or just a data point. Try to fit your finding into one sentence: this, because of this, means that. If coverage went up and sales went up, that's two facts, not an insight, until you can say why they moved together and what it means for what you do next. The moment you can't finish the sentence, you know you need to keep digging.
3. There are multiple ways to tell a story.
Sam gives you at least two structures, and the right one depends on the format. A client case study wants Problem, Solution, Outcome, the same three-part shape Harvard Business School has used in case studies for a century. A talk or a post wants the Pixar Pitch: once upon a time, every day, then one day, because of that, because of that, until finally. Same data, different shape, depending on whether someone's reading it or saying it out loud.
Take the course here: https://academy.meltwater.com/courses/using-data-smarter