Engage: Meta Updates to Facebook Metrics

Related products: Analyze - Earned Media Measurement Engage Measure
Engage: Meta Updates to Facebook Metrics

Exciting news from the digital frontiers: Meta is making changes to their Facebook metrics in its native reporting and API! March 2024 marks the debut of some key changes in the way we analyze our social media success. If you're keen to dive deeper, grab a cup of your favorite beverage and explore their original announcement.


Now, let's chat about what this means for Engage.


The deprecation only impacts three metrics in Engage:

  • ‘Page fans by gender and age’ has become ‘Impressions by age and gender’
    • ‘Page fans by gender and age’ provided the demographics of people following your page. It is being replaced by the new ‘Impressions by age and gender’ metric.
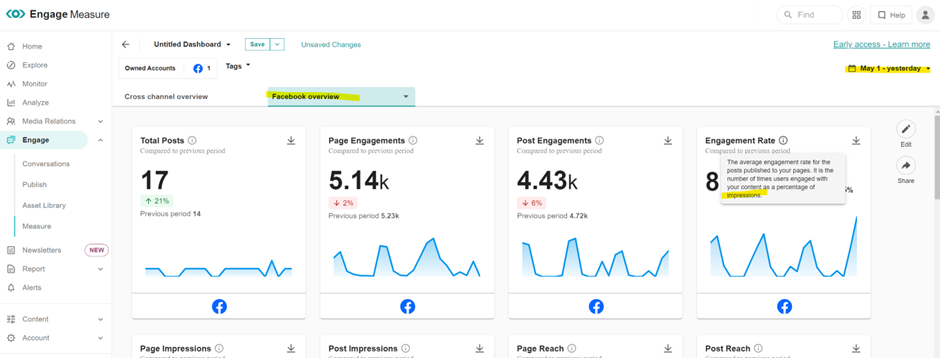
    • ‘Impressions by age and gender’ will now provide the demographics of people viewing your posts.
    • You can expect ‘Impressions by age and gender’ to be a smaller number compared to ‘Page fans by gender and age.’ Though smaller, we believe this metric will be more insightful and dynamic as it looks at the people consuming your content. By comparison, the demographic of Page followers are not likely to change significantly over time.
    • The updated metric will impact the Facebook Overview templates (both legacy and in Measure).
  • ‘Page-engaged users’ has become ‘Post-engaged users’
    • ‘Page-engaged users’ provided engagement activity at the Page level for a given time frame. 
    • The new ‘Post-engaged users’ provides engagement activity at the post level for all posts published within a given time frame.
    • What’s the key difference? There’s nuance here. ‘Page-engaged users’ did not consider the publish date of posts. So, for example, let’s say your time frame is the past 7 days. If a post published 12 months ago received engagement in the past 7 days, the ‘Page-engaged users’ metric would capture it. Differently, ‘Post-engaged users’ only captures activity from posts published within the past 7 days. 
    • The updated metric will impact the Facebook Overview templates (both legacy and in Measure).
  • Engagement rate has been recalculated
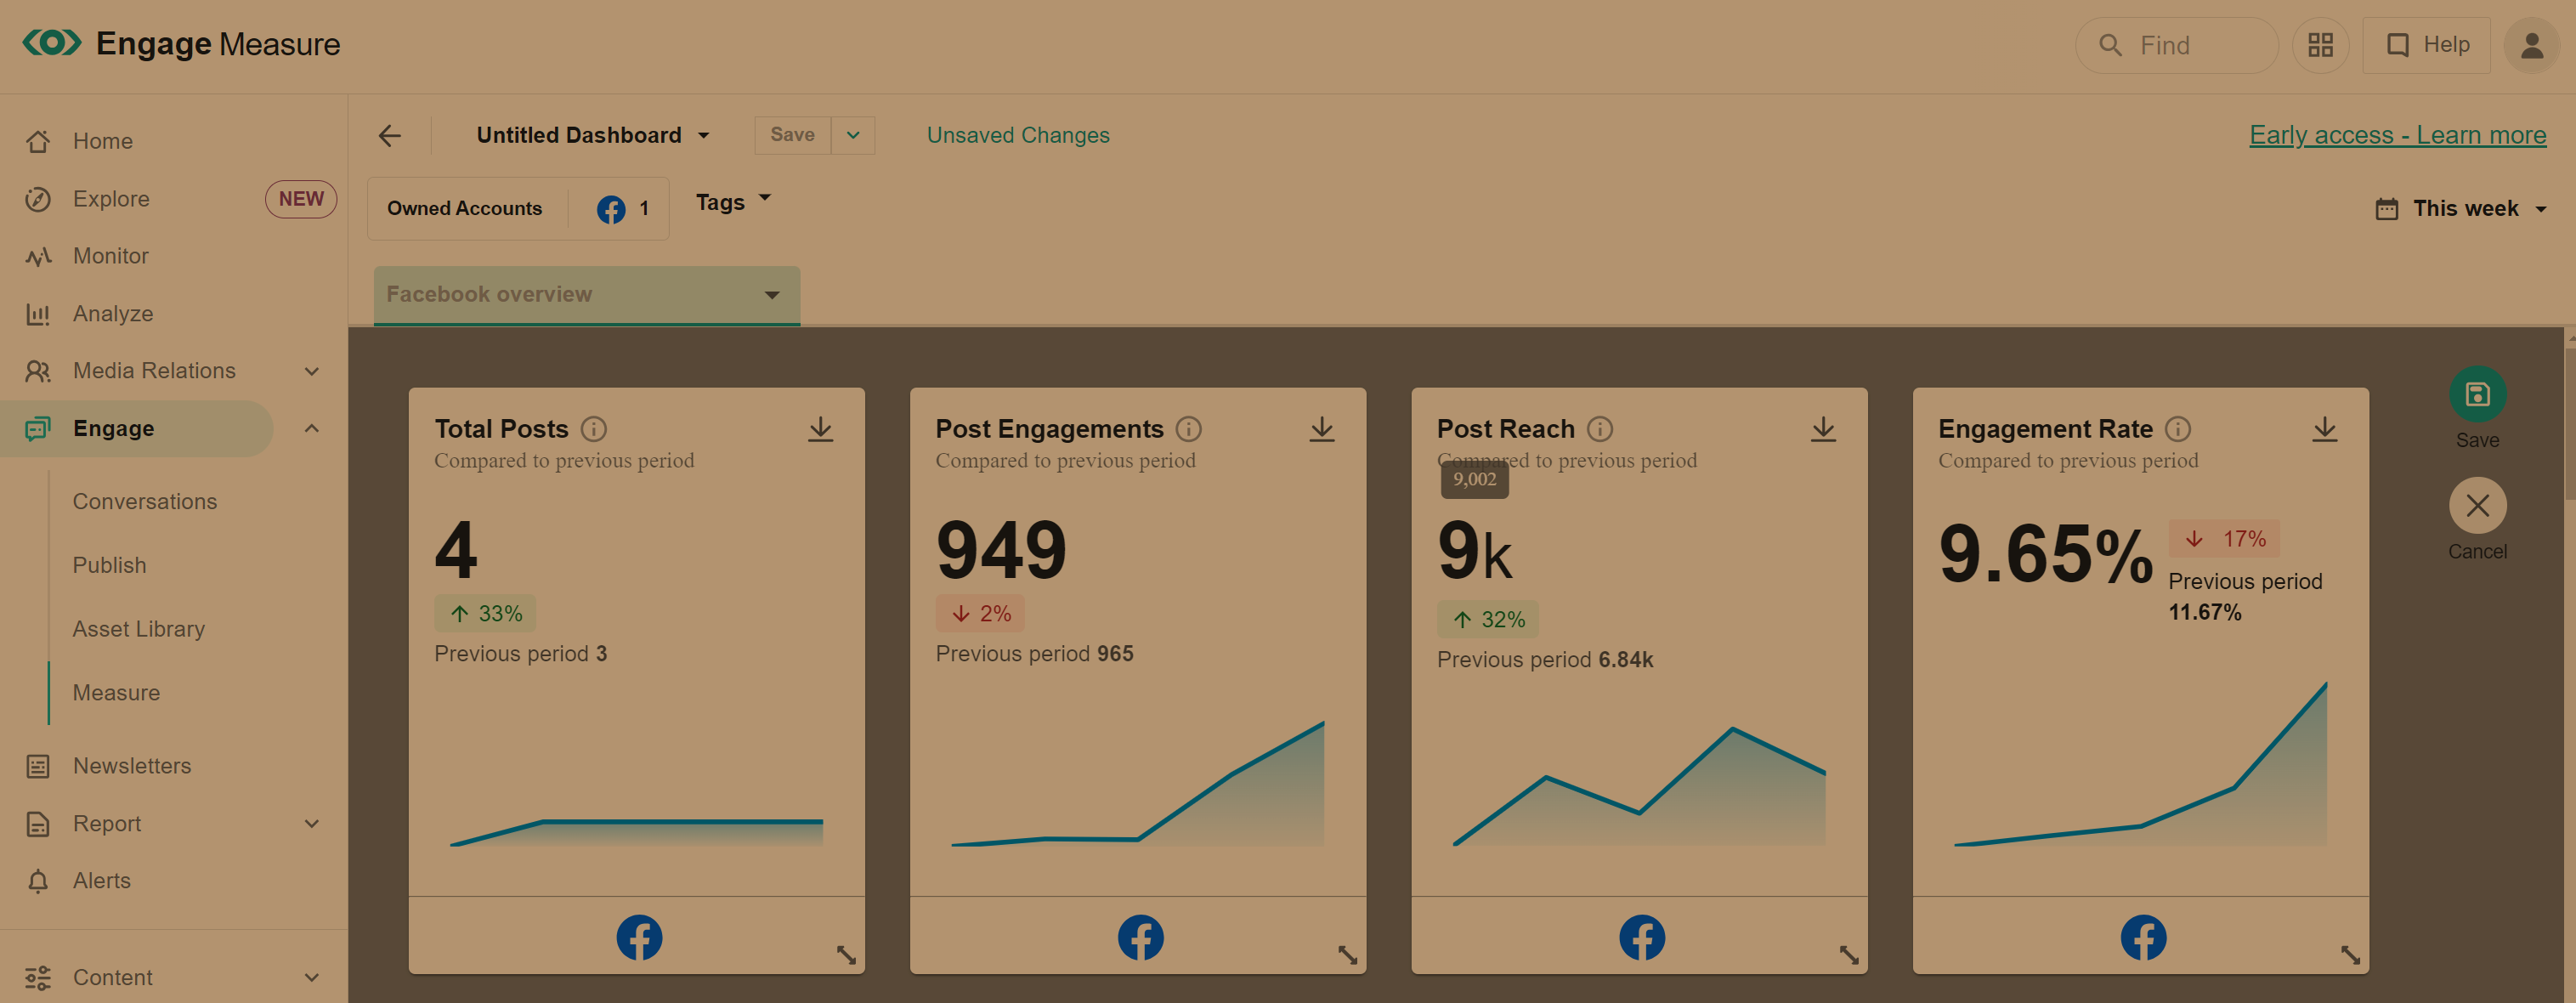
    • Facebook recently recalculated the engagement rate in its native reporting. Previously, it was calculated by dividing total engagement by post-engaged users. Now, It calculates it by dividing total engagements by reach.
    • We have recalculated our engagement rate to match Facebook’s new formula (total engagements divided by reach). The change will drive greater consistency between the reporting you do across native and in Engage.
    • The updated calculation will impact the Cross-Channel Overview and Facebook Overview templates (both legacy and in Measure).

The changes went into effect on March 21, 2024, and only impact data from March 21, 2024 onward.


Historical Data Updates


But wait, there's more!

We will now store historical data across Conversations, Publish, and Measure for as long as you are a customer. Previously, on average, we stored and surfaced data for no longer than 15 months. *This will continue to be 15 months for X/Twitter replies and mentions. 

Going beyond 15 months of data will help you in a number of ways. You’ll be able to run reports looking at your performance over multiple years, revisit an old thread with a loyal fan, or view analytics of your best-performing posts from years past.


Thanks for this breakdown!


Great news all around-- including the historical data!! 


@Maria Dehne When I was writing the update I was about to tag you into the historical data section to say I know you are going to be happy about this, but thought it might be a little too much. 


Never too much, @kelly.bebenek ! Thanks for thinking of me, and thanks for the efforts to make the update happen! 


It’s almost like social media is a full time job. LOL Lots of info here!


I do have a question around the revised way that Engagement rate is being calculated. Since it happened Mid March, for monthly reporting, I’d need to rebase my entire year using this updated metric. Will it be possible to rebase Jan - March 20, 2024 engagement? I know you said - “

  • The updated calculation will impact the Cross-Channel Overview and Facebook Overview templates (both legacy and in Measure)

If I go back to Jan and Feb, will it be revised based on the updated calculation?


Hey @BarBell24 - I checked in with our product team about this, and it sounds like if you go back to Jan and Feb, it will not be automatically revised based on the updated calculation. They did let me know that we’re able to rebase your data from Jan 1 forward and that your account manager will be following up with you early next week about that process. 🙌


Great update! Thanks @kelly.bebenek 


Hello, can you please clarify where the recalculated Facebook engagement rate based on reach is visible?

The engagement rate definition (where available) shows as being calculated by impressions on both of my Cross-Channel Overview and Facebook Overview tabs in Measure (date range after 21 March), as well as in the list of dashboard metrics definitions on the Getting Started with Measure page.


Hey @Saira Manns - great question! I’ve reached out to our Engage product team for clarification on this and either they or I will follow up here with more info ASAP


Hi again @Saira Manns! I’m back with an update: looks like this was an oversight in the documentation. We’ve updated the Help Center to say “reach,” and passed along the request to update the in-app tool tip. I can confirm that the engagement rate metric is calculated based on reach, consistent with this update post. Thank you so much for pointing this out and bringing this inconsistency to our attention!


Hey @Jacinda Espinosa, thanks for the response! I’m still a bit confused because the numbers I’m seeing in Engage don’t match the new calculation.

Example below:
Post engagements (949) divided by Post reach (9,002) = 10.54% 

But the Engagement rate widget is showing 9.65%


Hi @Saira Manns - I checked in with the Engage team on this again (shoutout @Nate Pallen !) and here’s what they (he) had to say: 

The engagement rate is calculated individually on each post. The summary is the average of the post engagement rate.

Meaning there are 4 posts with 4 different engagement rates. The average is 9.65% for those 4 posts. Using post engagements / post reach in aggregate won't add up, because they’re not measuring the exact same numbers.


Does this help clarify? 🙏


@Jacinda Espinosa @Nate Pallen Thank you for that clarification. To make sure I’m understanding correctly, the Post Engagements and Post Reach figures shown in the widgets don’t measure the exact numbers of the posts made within the selected timeframe? If not, what are they measuring? Do they include reach/engagements from posts published outside of the date range (but the engagement was within the timeframe), maybe?


Hey @Saira Manns, based on my understanding of this, I think the discrepancy here is based on the order of operations that the Engagement Rate widget uses to calculate vs. the way that you’re calculating it based on the numbers that you’re seeing. The Engagement Rate metric is calculated for each individual post, and then that number is averaged and that is the 9.65% you’re seeing on your dashboard. The way that you’re calculating it, by taking the total number of engagements and dividing by the total reach over these posts, will result in a similar but different figure (10.54% in this case). Does this help at all? 


Hey @Jacinda Espinosa, thanks so much for your patience, I understand now! 🙂


No worries at all, @Saira Manns! I’m glad it makes sense now 😄 I didn’t know this either, so we both learned something 💪